
For investors who use charts and price action to guide their choices, the idea of a technical breakout is a central strategy. The aim is to find stocks that are in a solid, confirmed uptrend and are also taking time to build on their advances. This building phase forms a possible base for the next upward move. A methodical approach to locate these chances is by using specialized ratings like the ChartMill Technical Rating and Setup Quality Score. The Technical Rating, from 0 to 10, measures the general condition and trend force of a stock. The Setup Quality Score, also from 0 to 10, assesses if the stock's present price formation presents a defined and manageable entry point. By selecting for stocks with strong results in both areas, traders can effectively find possible breakout candidates in stocks with good technical conditions.
Technical Force: A High-Level Stock
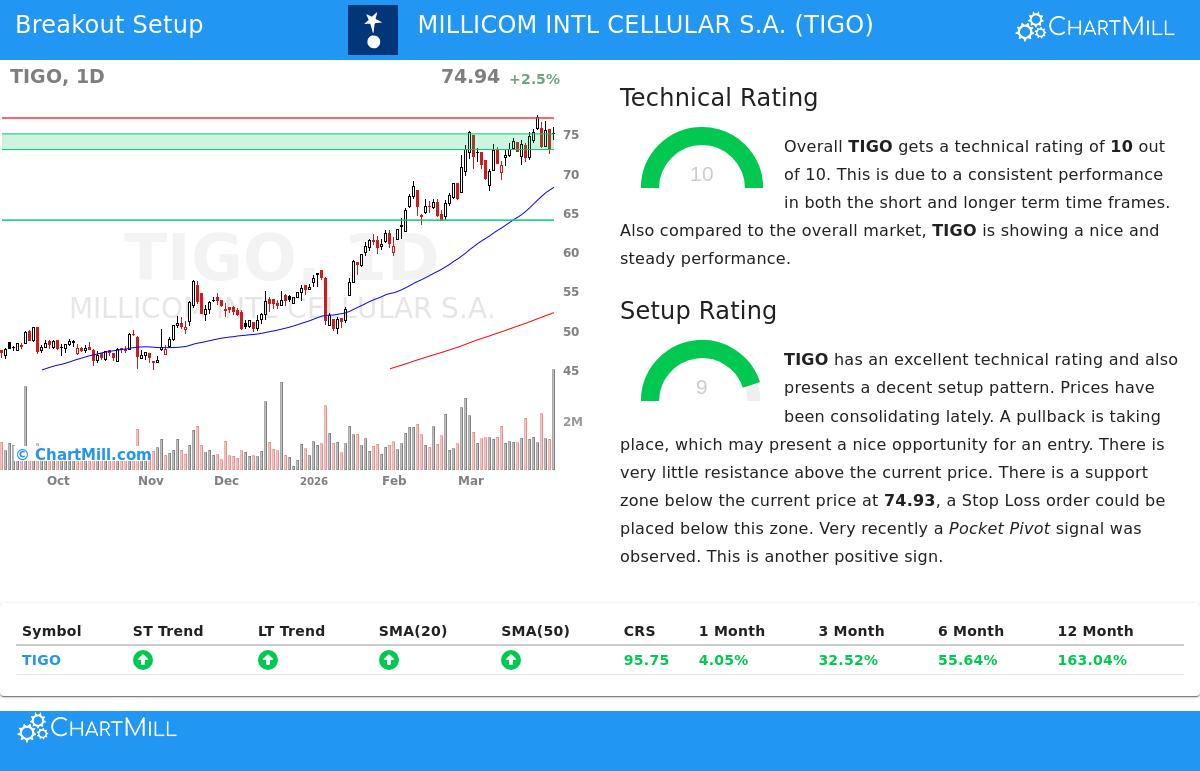
MILLICOM INTL CELLULAR S.A. (NASDAQ:TIGO) is notable with a top ChartMill Technical Rating of 10. This highest score shows very good technical condition across various periods, a key base for any breakout plan. A strong Technical Rating is important because it verifies the stock's basic momentum is solid and the main trend is positive, raising the chance that a breakout will continue instead of fading quickly.
The detailed technical report notes the foundations of this force:
- Trend Agreement: Both the long-term and short-term trends are marked as positive, showing unified upward momentum.
- Market Performance: The stock is doing better than 95% of all other stocks in the market over the last year and is trading close to its 52-week high. Importantly, while the wider S&P 500 is not reaching new highs, TIGO is, showing definite relative force.
- Moving Average Backing: The stock's price is trading above all its main simple moving averages (20, 50, 100, and 200-day), and each of these averages is itself in a rising pattern. This layered agreement of support levels is a standard feature of a solid uptrend.
- Strong Momentum: The performance numbers are solid, with the stock up about 32% over three months and over 163% in the last twelve months.
Setup Quality: A Building Phase Giving Entry
While a solid trend is needed, it is not enough for a good trade. A stock that has risen sharply may be stretched and likely to retreat. This is where the Setup Quality Score of 9 becomes key. A high setup score shows the stock is in a helpful building phase, letting it absorb earlier gains and form a foundation for its next advance. It addresses the important question of when to think about an entry.
The review for TIGO points to a positive setup formation:
- Recent Building Phase: The stock has been trading in an area between about $67.70 and $77.33 over the last month. It is now placed near the top of this area, indicating it may be preparing for a possible breakout.
- Defined Support and Resistance: The setup finds a clear support zone between $72.93 and $74.93, made by a combination of trendlines and moving averages. Above, nearby resistance is seen around $76.95. This definition allows for exact trade planning.
- Supportive Volume Activity: A recent "Pocket Pivot" signal, a positive formation where price rises on higher volume than recent lower days, has been recorded, hinting at buying by larger participants.
- Automated Trade Idea: Based on this formation, the review proposes a possible breakout entry above the $76.95 resistance level (for example, at $76.96) with a protective stop-loss order set below the main support zone at $72.92. This sets the trade's risk at about 5.25%.
Conclusion
TIGO offers a strong case for technical investors by showing the combination of a solid trend and a high-grade setup. Its top Technical Rating of 10 confirms it is a market performer in a maintained uptrend, while the Setup Rating of 9 shows it is coming out of a building period with defined, usable price levels. This pairing is exactly what the Technical Breakout screen method looks to find.
For traders wanting to look for similar chances, new possible breakout setups are found each day. You can see the present list of qualifying stocks by going to the Technical Breakout Setups screen.
Disclaimer: This article is for information only and does not form investment advice, a suggestion, or an offer to buy or sell any security. The review and any automated trade ideas are based on technical models and past data, which are not assurances of future results. Always do your own research, think about your risk comfort, and talk with a qualified financial advisor before making any investment choices.