
For investors who use charts and price action to make choices, a methodical way to find possibilities is important. One such technique looks for stocks that are both technically sound and building a positive pattern, indicating a possible price move upward is close. This method centers on two specific scores from ChartMill: the Technical Rating, which measures the general condition and direction of a stock, and the Setup Quality Rating, which evaluates how controlled and steady a stock’s recent price movement has been. The aim is to find leading stocks that are resting after an advance, giving a specific entry point with clear risk.
AT&T INC (NYSE:T) recently appeared in such a search, displaying a profile that technical traders may find interesting. The stock’s present formation indicates it is moving sideways within a confirmed upward direction, possibly preparing for its next upward move.
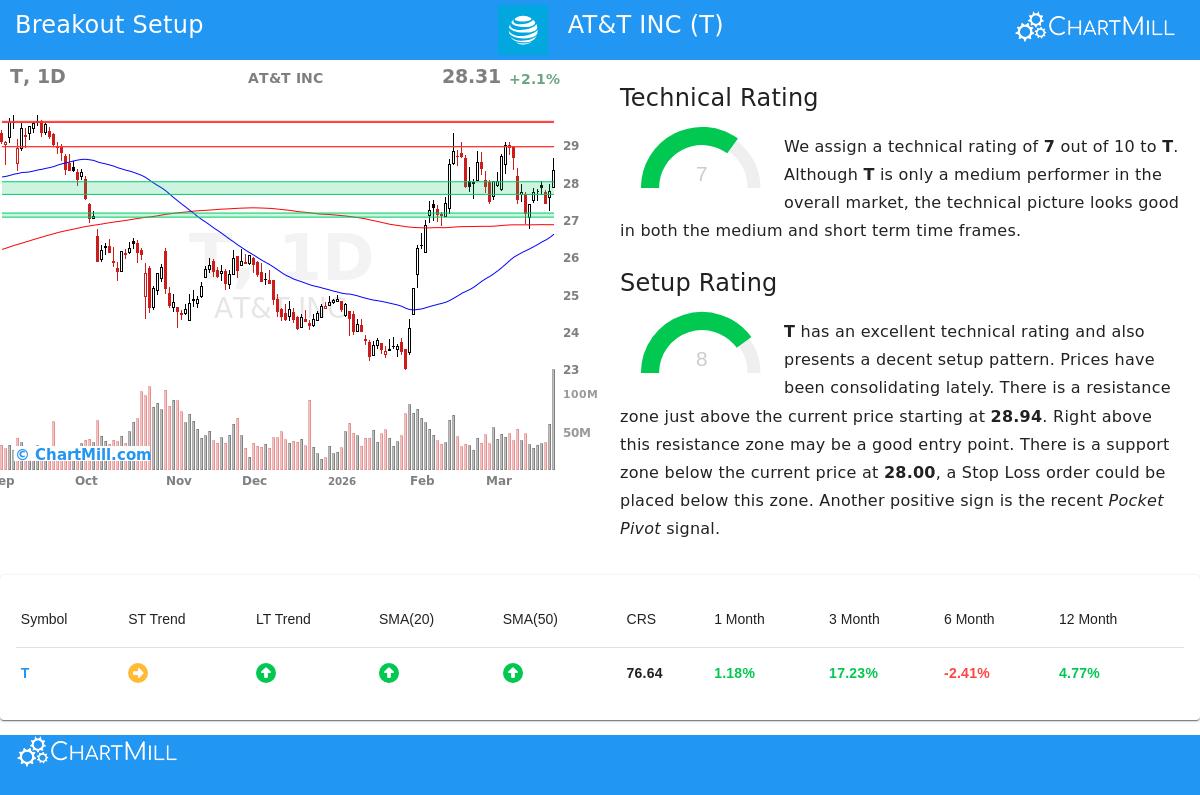
Technical Strength: A Firm Base
The base of any price move setup is a stock showing fundamental soundness. AT&T’s ChartMill Technical Rating of 7 out of 10 shows a stock in a confirmed upward direction, as ratings of 7 and above are usually given to stocks with positive momentum. This score is not assigned casually; it combines several elements including trend direction, moving average arrangement, and comparative performance.
A look at the full technical report for T shows several confirming details:
- Trend Arrangement: The long-term trend is scored as positive, while the short-term trend is neutral. This mix frequently comes before a continuation move, where a stock pauses before continuing its main direction.
- Market-Comparative Performance: The stock is trading in the higher section of its 52-week range, performing similarly to the wider S&P 500, which is also in the higher section of its range. This indicates T is not lagging in the present market setting.
- Moving Average Backing: The stock is trading above all its main simple moving averages (20, 50, 100, and 200-day), and each of these averages is itself in a rising arrangement. This layered arrangement of backing is a typical sign of a sound upward direction.
This technical rating is important for the price move method because it sorts for stocks that are already advancing. The idea is to follow the momentum of a sound stock, instead of trying to catch a declining stock or predict when a sideways stock will finally change direction.
Setup Quality: The Formation for a Chance
While technical soundness shows you which stock to observe, the setup quality shows you when it might be time to proceed. AT&T receives a good Setup Quality Rating of 8, which shows that the stock’s price movement has been moving sideways in a fairly narrow band. This sideways movement creates a specific area of conflict between buyers and sellers, giving clear points for entry and exit.
The technical report points out why T’s present formation is significant:
- Sideways Movement Band: Over the last month, T has traded between $26.73 and $29.07. It is presently located in the middle of this band, having moved down from recent highs, which can give a more acceptable risk/reward entry.
- Specific Support and Resistance: The analysis finds a clear support band between $27.66 and $28.00, created by a combination of trendlines and moving averages. Just above the present price sits a resistance point at $28.94. This creates a standard situation where a move above resistance could show a new wave of buying.
- Confirming Signs: The report also mentions a recent "Pocket Pivot" signal, a volume-based formation that often shows accumulation by larger participants during a sideways phase, adding another level of confirmation to the setup.
For a price move trader, this good setup score is the signal. It shows the stock is "tightening," and a move past the nearby resistance could be the trigger for the next strong price rise. The specific support point allows for a reasonable and close placement of a stop-loss order, controlling risk efficiently.
A Possible Trade Plan
Based on this review, the automated system proposes a specific, though example-only, plan. An entry could be thought about on a move above the $28.94 resistance point, using a buy-stop order. To control risk, a stop-loss order could be placed just below the support band at $27.65. This would establish a risk of about 4.5% on the trade itself. It is essential to emphasize that this is a mechanically created example for demonstration; investors must always do their own review and adjust any trade to their personal risk tolerance and method.
Finding Additional Possibilities
The search that found AT&T is executed each day, examining the market for comparable mixes of technical soundness and good-quality setup formations. For investors wanting to see the present list of possible price move candidates, the results are accessible here: View Today's Technical Breakout Setups.
Disclaimer: This article is for information only and does not make up investment guidance, a suggestion, or an offer to buy or sell any security. The review and trade examples shown are based on technical indicators and automated scoring systems, which are not assurances of future results. Investors should always do their own investigation and think about their personal financial situation before making any investment choice.