
Investors aiming to find stocks with high potential frequently search for a combination of solid technical patterns and strong fundamental improvement. One organized way to do this is joining Mark Minervini's Trend Template with a search for significant growth momentum. The Trend Template offers a strict technical list to confirm a stock is in a clear, strong uptrend, while a high-growth momentum filter looks for firms showing major gains in earnings and sales. This two-part method tries to find leading stocks early in their large price increases, mixing price pattern health with business speed.
SEAGATE TECHNOLOGY HOLDINGS (NASDAQ:STX) appears as a present example that fits this joined plan. The data storage company has formed a strong technical position and is also showing the sort of fundamental recovery that growth investors seek.
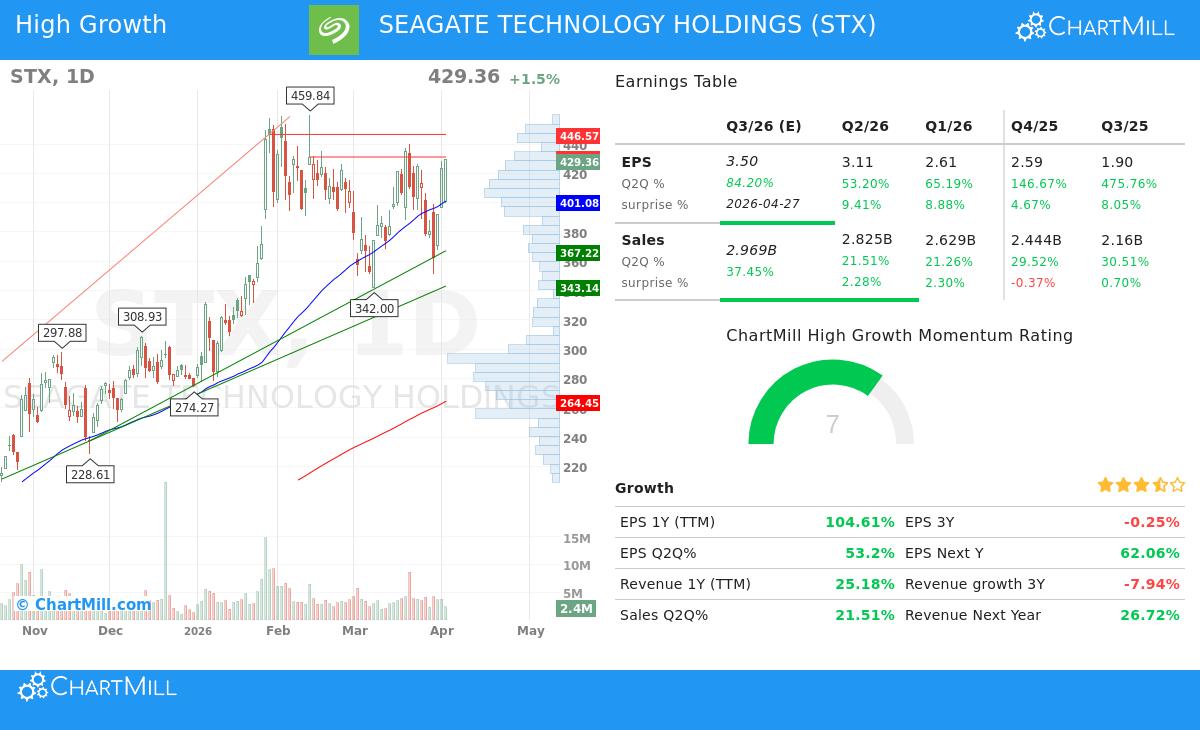
Technical Health: Fitting the Minervini Trend Template
Mark Minervini's Trend Template is made to sort for stocks in a clear Stage 2 uptrend, skipping unclear or poor formations. SEAGATE TECHNOLOGY HOLDINGS now meets the main technical rules, which is important for the plan as it confirms one is trading with the existing momentum.
A look at the main Trend Template points for STX shows a positive view:
- Price vs. Moving Averages: The present price of $429.36 trades much higher than its rising 50-day ($401.08), 150-day ($302.81), and 200-day ($264.45) simple moving averages (SMAs). This order confirms the stock is in a definite uptrend across all main time periods.
- Moving Average Order: The 50-day SMA is higher than both the 150-day and 200-day SMAs, and the 150-day SMA is higher than the 200-day SMA. This upward order points to increasing momentum, a sign of healthy trends.
- Nearness to Highs: The stock is trading within 7% of its 52-week high of $459.84, meeting the "within 25% of the high" rule. More notably, the present price is about 580% above its 52-week low of $63.19, greatly passing the needed 30% level. This shows unusual recovery health.
- Relative Strength: With a ChartMill Relative Strength (CRS) score of 99.25, STX does better than almost all other stocks in the market over the last year. High relative strength is a key part of the Minervini method, spotting market leaders before they are commonly known.
This technical base hints at institutional buying and a continued upward trend, giving the "trend" part needed for the SEPA (Specific Entry Point Analysis) method.
Fundamental Speed: The High-Growth Momentum Argument
While the chart shows the "what," the fundamentals explain the "why." The High Growth Momentum (HGM) rating for STX is backed by a sharp change in its financial results, giving the "catalyst" and "fundamentals" parts of Minervini's plan. Real growth leaders show speeding earnings and sales, often beating analyst expectations.
SEAGATE's recent numbers show this speed:
- Earnings Growth Jump: The company's earnings per share (EPS) growth is very high. Year-over-year EPS growth for the trailing twelve months is over 104%. Looking at recent quarters shows even greater momentum, with the last quarter growing 53% year-over-year, the quarter before up 65%, and the quarter before that rising nearly 146%.
- Profit Margin Growth: A main signal of operational gain and pricing strength is growing profit margins. STX's quarterly profit margin has increased in order from 15.74% three quarters ago to 20.99% in the newest report. This steady growth points to efficient scaling and healthy demand for its products.
- Healthy Revenue Comeback: After a time of decrease, revenue growth has come back strongly. Sales growth for the last quarter was 21.5%, and analysts have been raising their estimates, with next-year revenue estimates up nearly 5% in the last three months.
- Estimate Beats Growing Trust: The company has beaten EPS estimates in each of the last four quarters, with an average beat of 7.75%. This steady outperformance builds analyst and investor trust, often acting as a reason for more institutional buying.
This fundamental picture is not of a still company but one going through a strong cyclical and operational recovery, making it a real example for growth-focused investors.
Technical Report Summary and Formation Background
ChartMill's own technical report gives STX a very high Technical Rating of 10 out of 10, showing great health across many time periods and measures. The long-term trend is rated as good, and the stock does better than 99% of the market over the past year. The report notes clear support levels, including a area near the 50-day SMA around $399, which could act as a possible zone for new entries on dips within the current trend.
However, the report also gives important background for timing. The present Setup Quality rating is a 5, meaning that while the long-term trend is strong, the stock is not in a close, immediate formation best for a new breakout entry. It is trading near the high of its recent range. This highlights a main idea of the plan: a healthy trend must be matched with a correct entry point, often after a period of less movement. Investors may see this as a stock to add to a watchlist for a future formation rather than one to buy at present levels.
For a complete look at the support, resistance, and volume study, you can see the full ChartMill Technical Report for STX.
Locating Related Possibilities
SEAGATE TECHNOLOGY HOLDINGS shows the kind of example that appears when filtering for both strict trend-following ideas and high-growth fundamentals. For investors wanting to use this joined method to find other possible leaders, the ready-made filter is open for more study.
You can check the present results of the 'High Growth Momentum + Trend Template' filter here to view other stocks that meet these exact rules.
Disclaimer: This article is for information and learning only. It is not meant as investment advice, nor does it form a suggestion to buy, sell, or hold any security. The study is based on given data and certain methods; past results do not show future outcomes. Always do your own research and think about talking with a qualified financial advisor before making any investment choices. Please read our full disclaimer and terms of use for more information.