
In the world of growth investing, combining a strict technical framework with a focus on fundamental momentum can be an effective method for finding possible leaders. One strategy that shows this is the method made known by trader Mark Minervini. His system filters for stocks showing solid, confirmed uptrends using a specific "Trend Template," while also requiring strong and improving business fundamentals. This two-part method tries to find companies not only in a positive price path but also showing the earnings and sales growth that can support continued results. A scan made from these ideas, like a "High Growth Momentum + Trend Template" filter, tries to find securities that fit these strict technical and growth standards.
StoneX Group Inc (NASDAQ:SNEX) recently appeared from such a scan. As a global financial services network, StoneX works in commercial hedging, institutional trading, retail brokerage, and payments. The company's description suggests a varied model located inside the cyclical but necessary capital markets structure.
Looking at the Technical Trend
The main part of the Minervini method is the Trend Template, a group of required technical conditions made to verify a stock is in a strong, institution-led Stage 2 advance. For SNEX, a review of important measures shows agreement with this template:
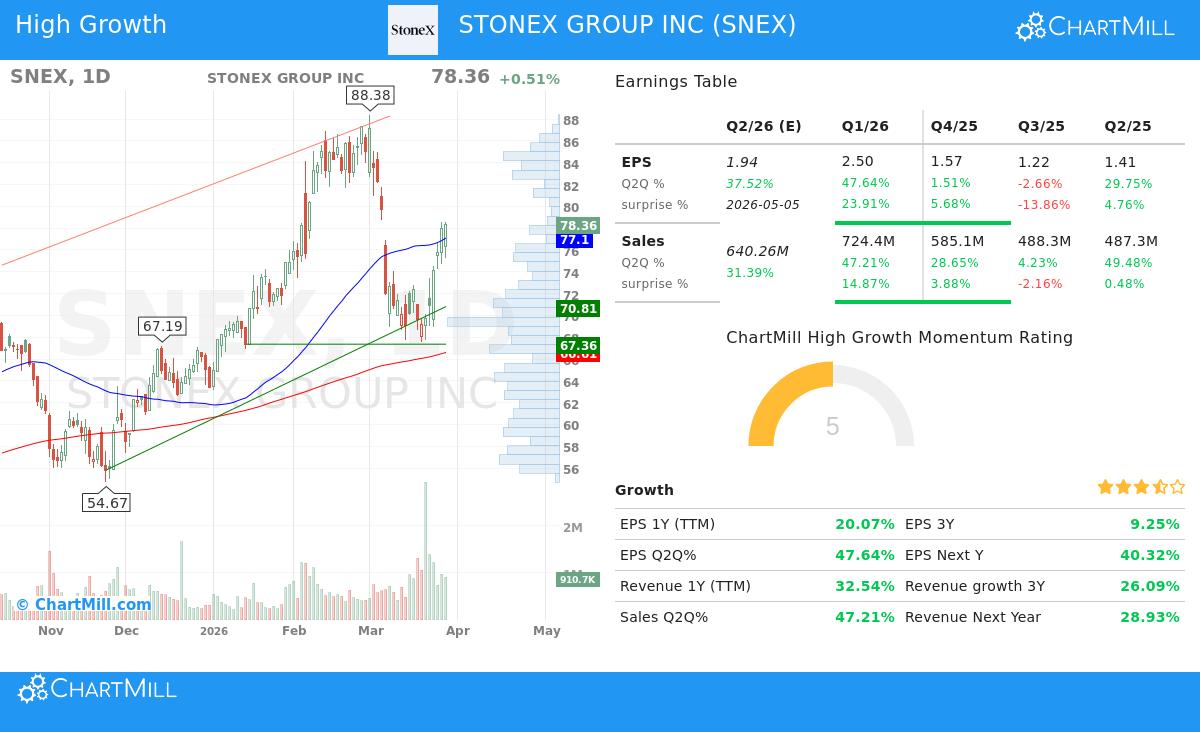
- Price vs. Key Moving Averages: The stock's last price of $78.36 trades above its rising 50-day ($77.10), 150-day ($68.39), and 200-day ($66.61) simple moving averages (SMAs). This ordered position shows continued buying interest across several time periods.
- Moving Average Order: The 50-day SMA is above both the 150-day and 200-day SMAs, while the 150-day SMA is above the 200-day SMA. This positive order of averages is a required filter in the Trend Template, confirming the uptrend's force and structure.
- Nearness to Highs: SNEX's price is about 80% above its 52-week low of $43.33, showing major recovery force. Also, at $78.36, it is trading within 11% of its 52-week high of $88.38. The Minervini idea stresses focusing on force, preferring stocks close to new highs instead of "low-priced" ones near lows.
- Relative Strength: With a ChartMill Relative Strength (CRS) score of 89.46, SNEX does better than nearly 90% of the whole market. More significantly, it does better than 94% of its group in the Capital Markets industry. High relative strength is a sign of market leadership, a main point of the strategy, suggesting the stock is being bought despite wider market situations.
This technical view meets the main scan need, showing SNEX is in a confirmed long-term uptrend with good relative results.
Reviewing the Growth Momentum
While the Trend Template deals with the "when," the "why" is often seen in the fundamentals. The High Growth Momentum (HGM) part of the scan looks for companies showing improving business results, which can act as a reason for more price gains. SNEX's recent financial measures show several good growth signs:
- Earnings Improvement: The latest quarterly EPS grew 47.6% year-over-year, a major improvement from the 1.5% growth seen in the previous quarter. This type of re-acceleration is a strong fundamental reason that often draws institutional attention.
- Solid Sales Growth: Revenue growth remains healthy, with the last quarter up 47.2% year-over-year. This comes after a time of very strong growth in earlier quarters (66.9%, 28.7%), showing continued top-line increase.
- Positive Estimate Changes: Analysts have been increasing their forecasts, a key sign of rising belief. The average EPS estimate for the next fiscal year has been moved up by 10.3% over the last three months, while revenue estimates have been moved up by 6.6%. Upward changes often come before continued stock outperformance.
- Profit Margin Growth: The company's profit margin in the last reported quarter was 34.4%, a clear growth from 25.2% in the quarter before and 17.5% two quarters prior. Getting better margins point to operational efficiency and pricing ability, improving the quality of earnings growth.
These points add to a positive growth story, supporting the idea that the technical move is supported by fundamental gains.
Technical Condition and Setup State
According to ChartMill's own analysis, SNEX gets a good Technical Rating of 7 out of 10. This rating confirms the stock is in a sound uptrend, supported by its high relative strength and position above key moving averages. The report states the stock has been a strong performer over the past year and that recent volume has risen on upward moves, a good sign.
However, the analysis also gives a lower Setup Quality rating of 3. This shows that while the trend is positive, the stock's recent price movement has been unstable and is not currently making a tight, lower-risk consolidation shape (like a Volatility Contraction Pattern) that would give a preferred, clear entry point. The summary proposes waiting for a time of consolidation to form for a better-probability setup.
For a full look at the support and resistance levels, trend study, and the complete reason for these ratings, you can see the complete technical report for SNEX.
Locating Like Possibilities
StoneX Group Inc shows a case where a solid fundamental growth story meets a long-term positive technical setup, fitting with the ideas of a combined momentum and trend-following strategy. Investors curious about using this strict scanning method to find other possible choices can inspect the preset scan. You can find more stocks that fit the High Growth Momentum + Trend Template standards by using this scanning link.
Disclaimer: This article is for informational and educational purposes only. It is not a recommendation to buy or sell any security. The analysis is based on data provided and certain scanning methods. Investors should do their own complete research, think about their personal risk tolerance, and talk with a qualified financial advisor before making any investment decisions. Past performance is not a guide to future results.