
For investors who use charts and price action to make choices, the search for good setups often involves looking for stocks that are both technically sound and ready for a move. One organized way to do this is using a Technical Breakout screen, which sorts for stocks showing two main traits: a high technical health score and a good consolidation pattern. The aim is to find securities already in clear uptrends but now in a pause, possibly giving a lower-risk entry point before their next rise. This process divides the "which" from the "when," first finding solid stocks and then finding good times for possible entry.
A recent scan using this method has pointed to SK TELECOM CO LTD-SPON ADR (NYSE:SKM) as a candidate needing more study from a technical view. The South Korean telecommunications company seems to be matching the standards looked for by breakout traders.
Technical Strength: The Base of the Setup
The first part of the breakout plan is finding stocks with basic technical soundness. A stock must be in a clear uptrend to be seen as a leader, not just rising in a downtrend. SK Telecom’s technical picture, as shown in its ChartMill Technical Report, displays a firm base.
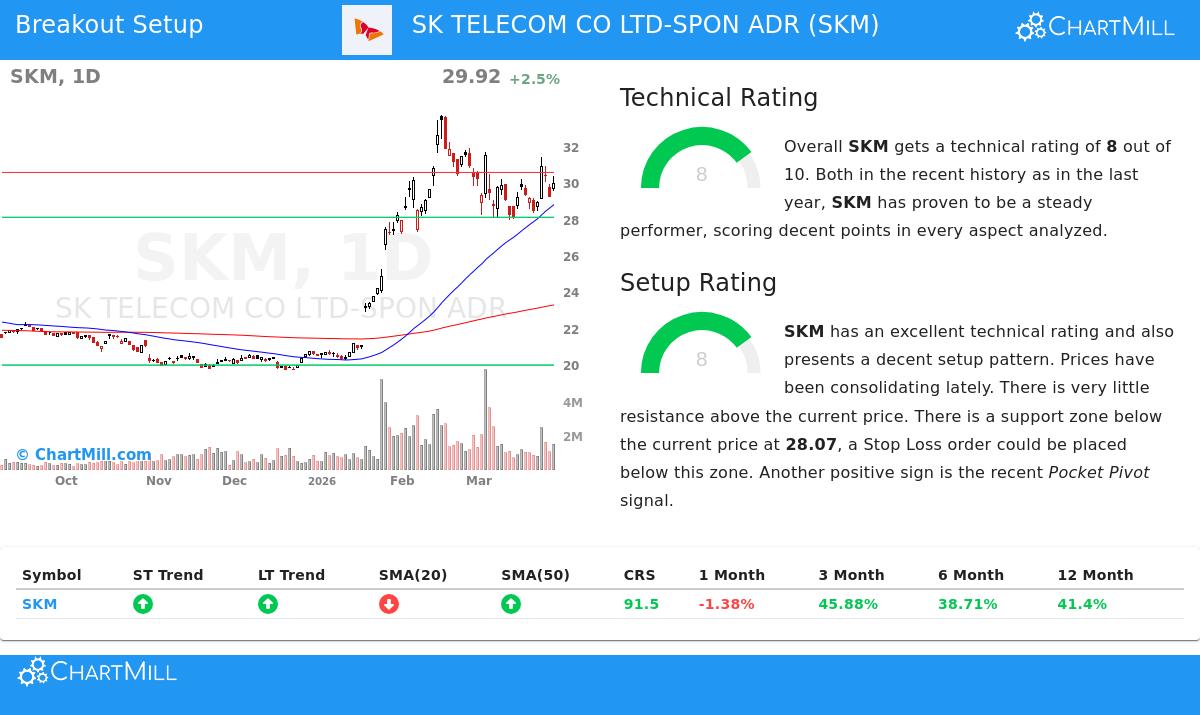
The stock gets a Technical Rating of 8 out of 10, putting it clearly in the "uptrend" group. This score is built by several good points:
- Positive Trend Alignment: Both the short-term and long-term trends for SKM are scored as positive. This agreement across time periods is a strong positive signal, showing continued buying pressure.
- Strong Relative Performance: SKM is doing better than 91% of all stocks over the last year and 80% of its group in the Wireless Telecommunication Services industry. This shows clear relative strength, a main feature of market leaders.
- Supportive Moving Averages: The stock is trading above its important moving averages (20, 50, 100, and 200-day), which are all in rising patterns. This arrangement shows wide support on declines.
This sound technical health answers the "which stock" question. It confirms SKM is not a speculative rise but a stock with momentum, making it a fitting candidate for a trend-following breakout plan.
Setup Quality: Finding the Entry Zone
A strong trend by itself is not a buy signal; entering after a big jump raises risk. The second part, the Setup Quality Rating, finds consolidation times within the uptrend. SKM scores an 8 here too, indicating it is forming a constructive pattern.
The study points to a trading range that has formed over the last month, between about $27.91 and $31.65. Now trading near $29.92, the stock is placed in the middle of this range, which the report says "may present a good entry opportunity." This consolidation has let the price absorb its notable gains, over 45% in the last three months, and bring it nearer to short-term moving averages.
Main parts of the setup include:
- Clear Support and Resistance: A defined support zone is found around $28.07, joining multiple trend lines. A nearby resistance level is at $30.54. These clear levels help traders control risk by placing stops below support and entries above resistance.
- Lower Volatility & Accumulation: The formation of a multi-week range suggests falling volatility, a usual sign before a directional move. Also, the report notes a recent "Pocket Pivot" signal, a volume-based sign that suggests accumulation by bigger participants during the consolidation, a positive indication for a possible upward breakout.
A Possible Trading Plan
Based on this technical and setup study, a sample breakout plan is made. The thinking follows the plan's ideas: enter on a confirmed move above resistance with a stop-loss to limit downside.
- Possible Entry: A buy stop order could be placed at $30.55, just above the found resistance trend line at $30.54.
- Possible Exit/Stop-Loss: A stop-loss order could be set at $28.28, placed below the nearby support zone and the 10-day low to protect capital if the breakout does not work.
- Risk Management: This example plan defines a risk of about 7.4% on the trade. For a portfolio-level risk management method, the position size would be changed so that a full loss on this trade would equal a set percentage of the total portfolio (for example, 1%).
It is very important to note that this is an example taken from the automated study. Traders must always do their own research, thinking about things like coming earnings reports and wider market state. The S&P 500, for example, is now in a negative trend on both a short and long-term basis, which can be a challenge for even good individual setups.
Finding More Chances
The Technical Breakout screen that found SK Telecom is an active tool that searches the market each day for similar matches of strength and setup. For investors wanting to see the current list of qualifying stocks, new possible breakout candidates can be viewed through the Technical Breakout Setups screen.
Disclaimer: This article is for information and learning only. It does not form a suggestion to buy, sell, or hold any security, nor is it meant as investment advice of any type. All trading and investment choices involve risk, including the possible loss of principal. The technical study and sample trade plans shown are based on automated data and should not be the only reason for any investment choice. Readers are told to do their own separate research and talk with a qualified financial advisor before making any investment choices.