
In the world of growth investing, combining a solid technical framework with strict fundamental analysis can be an effective method for spotting possible leaders. One strategy that shows this is the method made popular by trader Mark Minervini, which depends on his Specific Entry Point Analysis (SEPA) system. This approach tries to locate stocks showing firm upward trends, increasing fundamental growth, and a definite catalyst, all while focusing on exact, low-risk entry points. A main part is the Minervini Trend Template, a group of technical filters made to confirm a stock is in a verified, strong uptrend before it is even reviewed for investment.
For investors concentrated on high-growth possibilities, adding checks for outstanding earnings and sales momentum is vital. This two-part method, requiring both technical soundness and fundamental improvement, tries to separate companies that are not only rising but are doing so because of real, better business performance. This process methodically removes less strong candidates, directing focus on securities where price firmness and business growth are in agreement.
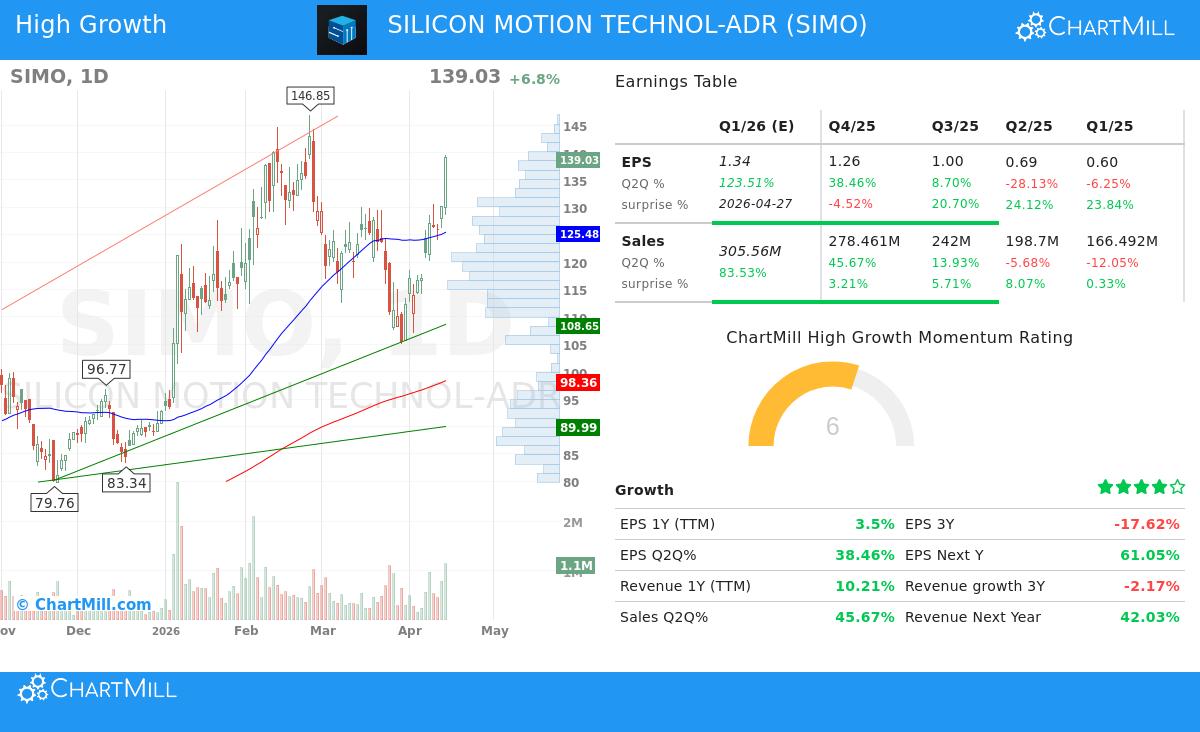
Silicon Motion Technology Corp. (NASDAQ:SIMO), a designer of NAND flash controllers and specialty RF semiconductors, recently appeared from a screen constructed on these exact ideas. The screen used the Minervini Trend Template to confirm technical firmness and combined it with a High Growth Momentum (HGM) rating to filter for fundamental improvement. We will look at how SIMO measures up against these strict standards.
Meeting the Minervini Trend Template
The Trend Template’s main aim is to spot stocks in a firm, confirmed Stage 2 uptrend, steering clear of those in basing or falling stages. It uses moving averages and price action compared to yearly highs and lows as its base. A check of SIMO’s technical factors shows it meets the central template needs:
- Price Above Key Averages: SIMO’s last price of $139.03 trades well above its rising 50-day ($125.48), 150-day ($105.83), and 200-day ($98.36) simple moving averages (SMAs). This order confirms the stock is in a continued uptrend across several timeframes.
- Moving Average Order: The 50-day SMA is above both the 150-day and 200-day SMAs, and the 150-day SMA is above the 200-day SMA. This "stacked" order is a standard sign of strong, organized buying pressure and a key feature of the Minervini setup.
- Nearness to Highs: The stock is currently within 5.3% of its 52-week high of $146.85, meeting the template's need to be within 25% of the high. At the same time, at 268% above its 52-week low of $37.82, it shows large recovery momentum.
- Better Relative Strength: With a ChartMill Relative Strength (CRS) score of 97.26, SIMO is doing better than 97% of all stocks in the market. High relative strength is a required principle of the Minervini method, as it spots market leaders that often lead rallies and show the strongest moves.
This technical view describes SIMO as a stock in a leading uptrend, a required first filter for the strategy. The template works to make sure an investor is only reviewing stocks where the path of least resistance is clearly higher.
Checking High Growth Momentum
While the Trend Template confirms the "how" of the price move, the High Growth Momentum rating tries to answer the "why" by checking the basic business fundamentals. Minervini’s idea states that the largest stock winners are nearly always backed by firm, and often improving, growth in earnings and sales. The given data on SIMO shows several good fundamental catalysts:
- Recent Earnings Improvement: The most recent quarter shows a strong year-over-year EPS growth of 38.5%, a notable improvement from the 8.7% growth in the quarter before. This recovery is a key good signal.
- Firm Forward Estimates: Analyst positive view is clear, with the average estimate for next quarter's EPS growth at 123.5%. Also, next year's EPS estimates have been adjusted upward by 17.2% over the last three months, showing increasing belief in the company's profit path.
- Sales Growth Recovery: After a time of decrease, revenue growth has turned sharply positive. The last quarter saw sales grow 45.7% year-over-year, and estimates point to 83.5% growth for the next quarter. Next year's revenue estimates have also been adjusted up by 20.9%.
- Steady Execution: The company has exceeded EPS estimates in 3 of the last 4 quarters by an average of 16%, and has exceeded revenue estimates in all of the last 4 quarters. This record of beating expectations builds trust with investors.
- Growing Profitability: The profit margin in the last reported quarter was 17.1%, showing a gain over the 16.2% margin in the quarter before. A trend of growing margins suggests better operational efficiency and pricing power.
These factors add to a strong growth story. The mix of recovering quarterly growth, positive analyst adjustments, and steady execution matches the kind of fundamental profile looked for by high-growth investors using the Minervini structure, where "big earnings draw big attention."
Technical Condition and Setup Points
According to ChartMill’s own analysis, SIMO gets a top-level Technical Rating of 10 out of 10, showing outstanding condition across short and long-term trends. The report states the stock is showing a "nice and steady pattern of rising prices" and does better than 82% of its semiconductor industry peers. Both the short-term and long-term trends are rated as positive, which is a very firm sign.
However, the analysis also gives a note of care for entry timing. The Setup Quality rating is currently a low 1, with the summary stating, "Prices have been rising strongly lately, it may be a good idea to wait for a consolidation or pullback before considering an entry." This is a key point. While the stock meets trend and growth standards, the Minervini strategy focuses on particular, low-risk entry points, often during a volatility decrease following a rise. The current stretched price action suggests waiting may be needed for a best risk/reward setup.
For a full breakdown of support/resistance levels and the complete technical story, you can check the detailed ChartMill Technical Report for SIMO.
Locating Comparable Possibilities
SIMO shows the kind of candidate that appears when screening for both technical trend firmness and fundamental growth momentum. Investors trying to use this strict method to locate other possible opportunities can run the same screen. Click here to view the 'High Growth Momentum + Trend Template' screen on ChartMill for more results.
Disclaimer: This article is for informational and educational purposes only. It is not a recommendation to buy or sell any security. All investing and trading involves risk, including the potential loss of principal. You should conduct your own research and consult with a qualified financial professional before making any investment decisions.