
Based on the principles outlined by legendary investor Peter Lynch, a strategy focused on finding well-run, growing companies trading at reasonable prices can be a foundation for long-term portfolio building. Lynch’s method, often called Growth at a Reasonable Price (GARP), stresses sustainable business growth, strong financial health, and a good price, avoiding speculative stocks for companies with clear, lasting operations. A stock screener using his rules looks for firms with steady earnings growth, high profitability, solid balance sheets, and an attractive price compared to that growth.
One company that recently appeared from this type of screen is DR. REDDY'S LABORATORIES-ADR (NYSE:RDY), a major global pharmaceutical company based in India. The company’s presence on the list indicates its financial characteristics match the disciplined, long-term growth investing ideas Lynch supported.
Match with Lynch's Main Rules
The Peter Lynch screen uses specific number-based filters to find candidates. DR. Reddy's Laboratories passes these important checks, which are made to find companies with lasting growth and good finances.
- Lasting Earnings Growth: Lynch wanted companies growing steadily. The screen looks for a 5-year Earnings Per Share (EPS) growth rate between 15% and 30%. DR. Reddy's reports a solid 5-year EPS growth of 23.6%, fitting within this range. This shows a history of strong, and possibly maintainable, profit increase.
- Good Price via PEG Ratio: A very important Lynch measure is the Price/Earnings to Growth (PEG) ratio, which tries to find stocks where the price is fair for the growth rate. A PEG ratio at or below 1 is seen as good. With a PEG ratio of 0.80, DR. Reddy's trades at a price that rewards investors for its past growth, a key idea of the GARP method.
- High Profitability (ROE): Lynch liked companies that create high returns on shareholder equity. The screen demands a Return on Equity (ROE) above 15%. DR. Reddy's does well here, with an ROE of 16.0%, showing effective use of investor money to create earnings.
- Careful Financial Health: To avoid companies with too much debt, the screen looks for a Debt-to-Equity ratio below 0.6. DR. Reddy's displays an extremely careful balance sheet with a Debt-to-Equity ratio of only 0.03, much better than the requirement and matching Lynch's liking for companies funded mainly by equity.
- Sufficient Short-Term Liquidity: Making sure a company can pay its near-term bills, the screen requires a Current Ratio of at least 1. DR. Reddy's ratio of 1.85 shows a good supply of current assets compared to current liabilities.
Fundamental Condition Review
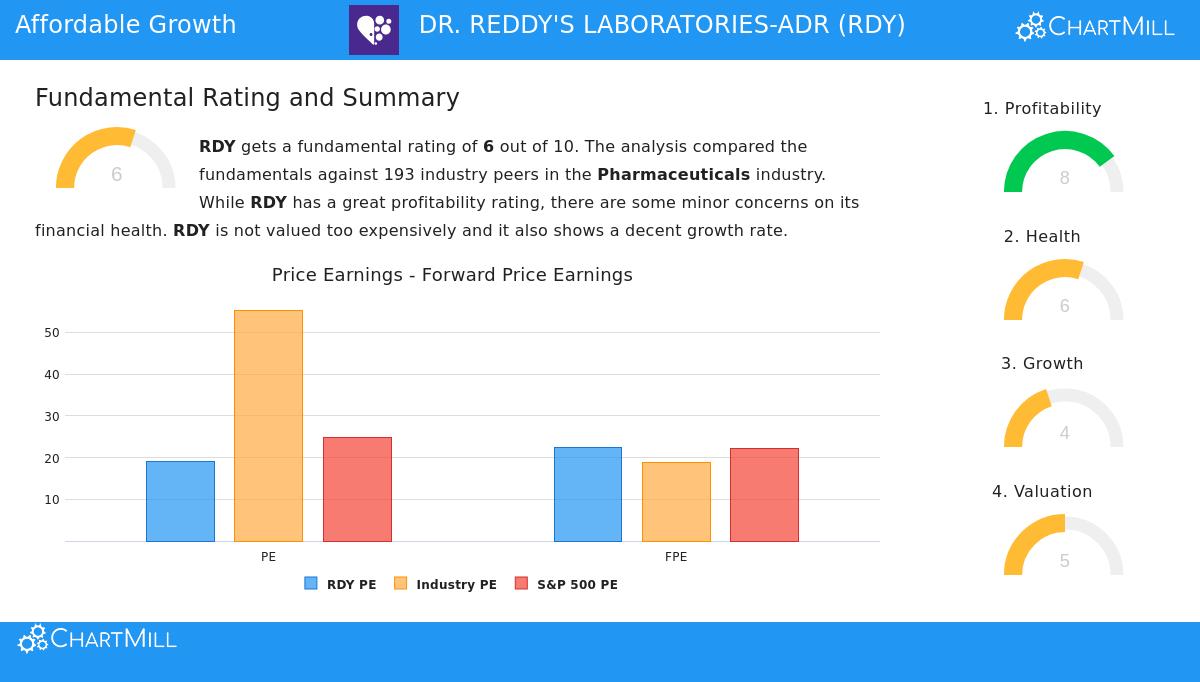
A wider view of DR. Reddy's fundamental analysis report gives details beyond the screen's filters. The company gets an overall fundamental score of 6 out of 10. Its notable area is profitability, where it scores an 8, having industry-best margins and returns on assets and invested capital. Financial health is scored a 6, backed by a very strong solvency position (high Altman-Z score and very little debt) though with liquidity ratios that are only acceptable for its industry.
On price, the report gives a score of 5. While its P/E ratio seems high in absolute terms, it is viewed as low compared to its pharmaceutical industry peers. The growth score of 4 shows strong past results but mentions expectations for a slower growth rate in the future, a point for investors to study more. You can see the full fundamental analysis for DR. Reddy's Laboratories here.
A Prospect for the Long-Term Investor
For an investor following the Peter Lynch method, DR. Reddy's Laboratories offers an interesting profile. It works in the necessary, clear healthcare field, a kind of "simple" business Lynch liked. The number-based screening results show it has provided the kind of profitable, controlled growth Lynch wanted, all while keeping a very strong balance sheet. The below-1 PEG ratio implies the market may not completely value its past growth path.
It is key to remember that any screen is a beginning for more study, not a recommendation to buy. Potential investors should study the company's competitive strengths, pipeline of generic and branded drugs, management plans, and the causes for the expected growth slowdown.
Interested in seeing other companies that match the Peter Lynch investment profile? You can run the screen yourself and see the full list of current prospects here.
Disclaimer: This article is for informational purposes only and does not constitute financial advice, a recommendation, or an offer to buy or sell any securities. The analysis is based on data provided and certain investment methodologies. Investors should conduct their own due diligence and consult with a qualified financial advisor before making any investment decisions.