
For investors using technical analysis, the search for good chances often comes to two main questions: which stock is in a strong trend, and when is the right time to buy it? A structured way to answer these questions uses a filter for stocks that join good technical condition with a clear, usable price pattern. This process finds leading stocks that are both in clear uptrends and moving in a narrow band, preparing for a possible move to higher prices. By selecting for high technical and setup quality scores, traders try to find stocks where the direction is positive and the balance of potential gain against loss is marked by close price floors and ceilings.
Technical Strength: A Base of Direction
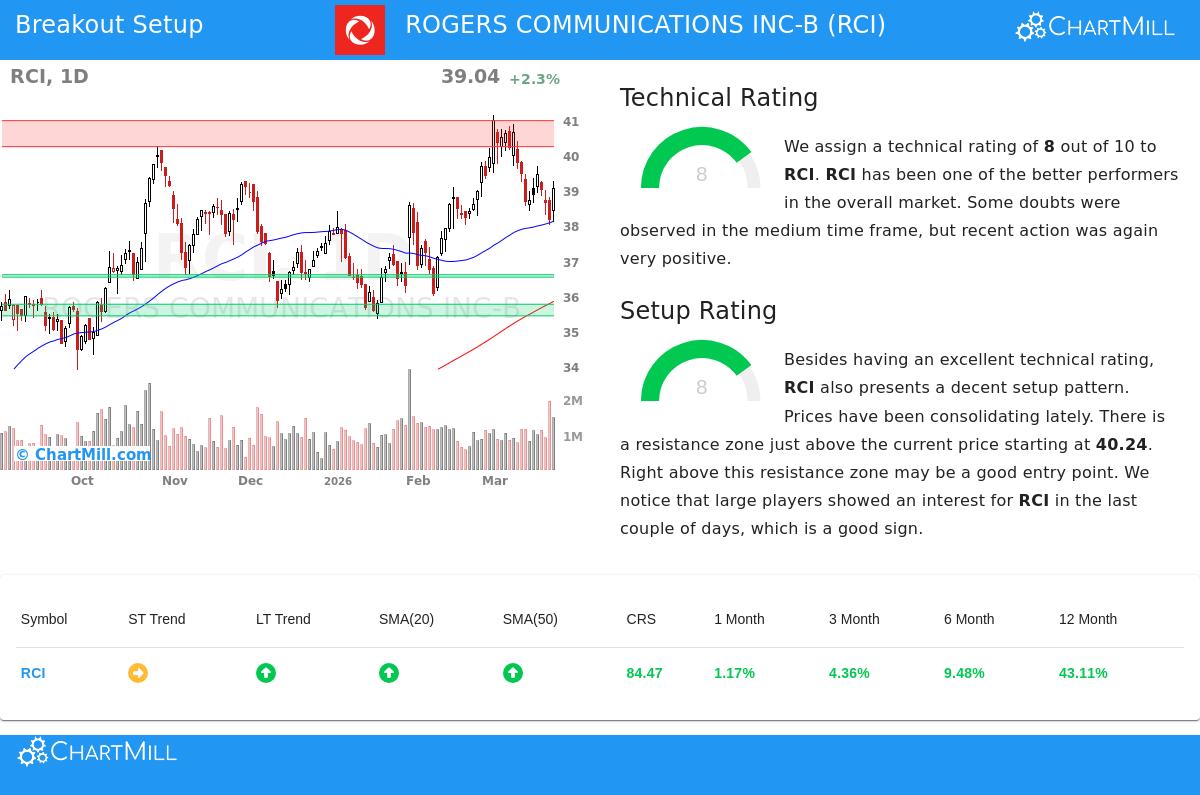
The first part of this plan is finding a stock with good basic technical direction. Rogers Communications Inc-B (NYSE:RCI) gets a solid Technical Rating of 8 out of 10, showing it is in a good uptrend. This number comes from measuring parts like comparative strength, trend agreement, and moving average placement. The information from the full technical report shows a clear view of continued condition.
- Long-Term Trend and Results: The long-term trend for RCI is called positive, a key base for any breakout candidate. This is supported by strong yearly results, with the stock doing better than about 84% of all stocks in the market over the last twelve months. This kind of strong comparative result points to large investor activity and a likelihood for the stock to keep or improve its price even when the wider market is lower.
- Price Location and Moving Averages: RCI is now trading in the higher part of its 52-week range, matching the S&P 500's own location. More significantly, the stock price is above important rising moving averages, including the 50-day and 200-day SMAs, which frequently serve as changing support levels in a good uptrend.
- Industry Position: Inside the active Wireless Telecommunication Services field, RCI places above 66% of similar companies, showing field-relative condition which is better than investing in a weaker performer.
This mix of a positive long-term trend, better market-relative results, and agreement with rising moving averages supports the high technical rating. For the breakout plan, a high technical score is necessary because it raises the chance that a breakout from a holding pattern will keep going in the direction of the main trend, instead of stopping or turning down.
Setup Quality: The Skill of the Entry
A strong trend by itself is not a signal to buy; entering a stock that has just completed a big, stretched move can be dangerous. The second key element is the Setup Quality Rating, which measures the holding pattern. RCI also gets an 8 here, meaning it is making a high-grade base. This score evaluates how closely prices have been trading, nearness to moving averages, and the existence of clear support areas.
- Holding Pattern and Price Movement: The stock has been trading in a set band between about $38.02 and $41.14 over the last month. While this band is described as "quite wide," the stock is now trading near the lower part of this band, possibly giving a more attractive entry point nearer to support before a breakout try. The existence of this holding pattern after a strong upward move is a standard formation that lets the stock absorb its gains.
- Set Support and Resistance: The technical study finds specific price levels that describe the setup. Two significant support areas lie below, at $36.53-$36.60 and $35.43-$35.76, giving clear places where a stop-loss order could be reasonably set if the trade does not work. Above, a set resistance area is between $40.24 and $40.98. A clear move above this resistance could mark the next part of the uptrend.
- Large Investor Activity: A positive point from the report is that big investors have shown activity in RCI in recent days, as seen in volume study on shorter timeframes. This can be an early sign of a notable price change.
The high setup score is important for the plan because it finds a point of balance. It suggests the stock is resting inside its uptrend, offering a possible entry point with a close, reasonable exit if the expected breakout does not happen. This helps control risk, which is very important in technical trading.
A Possible Breakout Situation
Combining the technical condition and setup quality, the study proposes a possible trading situation. The reasonable entry for a breakout would be just above the found resistance area, around $40.42, which would mean a move above recent holding pattern highs. A protective stop-loss could be set below the recent band low near $38.01, setting the trade's risk. It is very important to recall that this is an example made from the technical formation; real entry and exit points should be adjusted to a person's risk comfort and verified by price movement.
Finding Other Chances
Rogers Communications (RCI) shows the kind of chance a technical breakout filter is made to find: a market leader pausing inside a strong uptrend. For investors looking to use this process to find similar setups each day, new results from the Technical Breakout Setups filter can be found here.
Disclaimer: This article is for information only and is not investment guidance, a suggestion, or an offer to buy or sell any security. The study uses technical information and automatic scoring models. Investors should do their own study, think about their money situation and risk comfort, and talk with a qualified financial advisor before making any investment choices. Past results do not guarantee future outcomes.