
When looking for long-term investment opportunities, focusing on companies that combine steady growth with reasonable valuations is a time-tested approach. One such method, popularized by legendary Fidelity fund manager Peter Lynch, is known as the GARP strategy, Growth at a Reasonable Price. As detailed in his book One Up on Wall Street, Lynch advocated for buying growing companies at fair prices while ensuring solid financial health and avoiding the hype of unsustainable high-growth stocks.
PTC INC (NASDAQ:PTC) is a global software company specializing in computer-aided design (CAD) and product lifecycle management (PLM) solutions. With its strong fundamentals and alignment with Lynch’s investment criteria, this stock stands out as a potential candidate for GARP investors seeking long-term value.
Recent Performance
PTC has demonstrated solid financial momentum. The company posted an impressive 23.62% revenue growth over the past year, with earnings per share (EPS) surging by a remarkable 73.62%. Over a five-year period, EPS has grown at an average annual rate of 25.59%, placing it well within Lynch’s preferred growth range of 15% to 30%. This reflects genuine, sustainable expansion rather than a speculative spike.
Looking ahead, analysts project EPS will continue to grow by 11.30% annually, with revenue growth expected to average 8.40% per year. While future growth rates are slightly lower than historical peaks, the trajectory remains strong and steady.
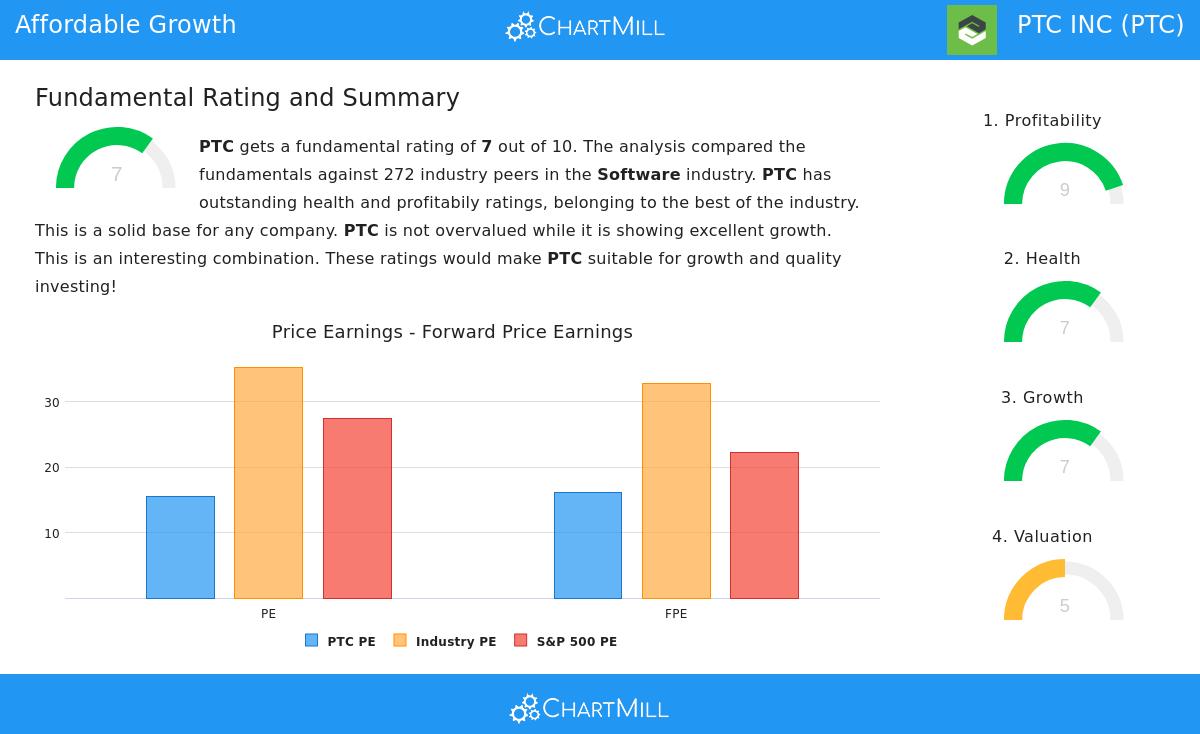
Valuation Metrics
Valuation is a cornerstone of Lynch’s strategy, and PTC scores well here too. The stock trades at a price-to-earnings (P/E) ratio of 15.55, which is significantly below the S&P 500’s average P/E of around 27.42. This suggests the stock is reasonably priced relative to the broader market.
More importantly, the PEG ratio—which adjusts P/E for growth—stands at an attractive 0.61. Lynch considered a PEG ratio below 1.0 as a key buy signal, indicating that the company’s growth is not adequately reflected in its share price. Additionally, the enterprise value-to-EBITDA and price-to-free-cash-flow ratios are both favorable compared to industry peers, reinforcing the view that the stock is undervalued relative to its earning power.
Financial Health
PTC maintains a healthier balance sheet than many of its software industry peers. The debt-to-equity ratio is a conservative 0.31, well under Lynch’s maximum threshold of 0.6, implying the company is not overly reliant on debt financing. Its current ratio of 1.22 ensures adequate liquidity to cover short-term obligations.
The return on equity (ROE) is 21.30%, exceeding the 15% minimum that Lynch required. This indicates efficient use of shareholder capital and strong profitability. In fact, PTC’s overall financial health rating is 7 out of 10, as highlighted in the fundamental analysis report, with excellent scores in profitability and solvency measures such as the Altman-Z score of 5.31, well above the danger zone.
Analyst Views
While analyst coverage remains moderate, the underlying fundamentals speak volumes. Profit margins are consistently strong—gross margin at 84.23%, operating margin at 39.28%, and profit margin at 28.61%—all ranking among the best in the software sector. Return on assets (12.73%) and return on invested capital (16.99%) also highlight efficient capital allocation, a trait Lynch valued highly.
The company has also been reducing its share count over the past year, reflecting a buyback program that aligns with Lynch’s preference for management that returns value to shareholders.
More Opportunities for GARP Investors
PTC fits exceptionally well into the Peter Lynch GARP framework: consistent but not explosive growth, reasonable valuation, low debt, and strong profitability. It offers investors exposure to a stable software business that is well-positioned for the long term without relying on unsustainable growth rates.
If you’re interested in discovering additional stocks that meet these same strict criteria, you can find more results by exploring the Peter Lynch Strategy Screen on ChartMill. This screener applies Lynch’s core principles—EPS growth of 15% to 30%, PEG ratio below 1, debt-to-equity below 0.6, current ratio above 1, and ROE above 15%—to uncover other promising GARP candidates worth researching further.
Disclaimer: This article is for informational purposes only and does not constitute investment advice. Always perform your own due diligence before making any investment decisions.