
For investors who use technical analysis to find possible trades, the process often comes to two basic questions: which stock to buy, and when to buy it. A structured way to answer these questions involves looking for stocks that are both technically sound and building a constructive price pattern. This approach centers on finding equities in clear uptrends that are now pausing, providing a more distinct entry point with understood risk. One instrument that aids this search is the Technical Breakout Setups screen, which sorts for stocks with high proprietary scores for both technical condition and pattern quality.
A recent scan using this method has pointed to PFIZER INC (NYSE:PFE) as a candidate deserving more attention from a technical viewpoint. The biopharmaceutical company, while managing a difficult post-pandemic market, is now showing chart traits that technical traders frequently look for.
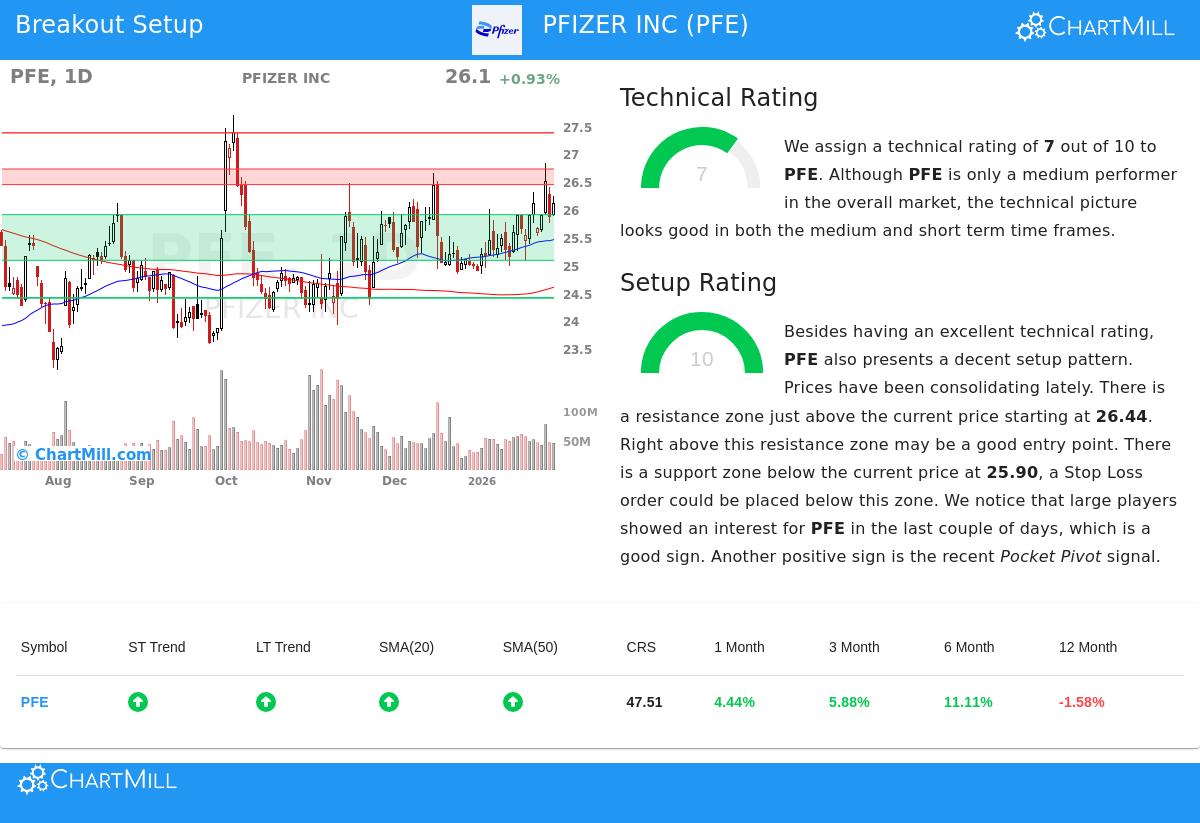
Examining the Technical Base
The first part of this plan is finding stocks with a base of technical soundness, which implies a lasting trend is present. According to the detailed technical report for Pfizer, the stock receives a ChartMill Technical Rating of 7 out of 10. This score measures the stock's technical condition by reviewing multiple time periods and elements compared to the wider market.
A score of 7 puts PFE clearly in uptrend area, a key filter for this breakout plan as it favors stocks with momentum already present. The report supports this view with several good notes:
- Both the short-term and long-term trends for PFE are labeled positive.
- The stock is priced above all its main simple moving averages (20, 50, 100, and 200-day), and each of these averages is itself in a rising pattern.
- PFE is now trading in the higher part of its 52-week range.
While the report states that PFE's one-year performance is about equal to the wider market, its recent multi-month performance has been good. This base soundness is important because it raises the chance that a breakout from a pausing pattern will keep going in the direction of the existing trend, instead of stalling or turning down.
Reviewing the Pattern Quality
A sound trend by itself is not a sign to buy, entering a stock that has just made a big, extended move can be hazardous. The second vital question, when to buy, is answered by the pattern quality. This is where PFE's chart becomes especially notable. The stock has received a complete ChartMill Setup Rating of 10, showing a very good pausing pattern is now present.
A high pattern score implies the stock has been trading in a fairly narrow range, letting volatility settle and forming a distinct level of support below the present price. This pause gathers energy and gives a structured area from which the next price move can begin. The technical report for PFE describes this pattern clearly:
- Prices have been pausing inside a set range over the last month.
- A notable support area has been formed between $25.08 and $25.90, made by a meeting of trendlines and moving averages.
- The report notes recent "Pocket Pivot" activity and interest from large investors, which are seen as positive additional signals within this situation.
For a trader, this high-quality pattern means a specific plan. The pause marks a possible entry point just above the recent resistance (near $26.73) and a reasonable stop-loss level just below the noted support area. This structure allows for a trade with a preset and quantifiable risk, which is a key part of careful technical trading.
A Candidate for a Breakout Watchlist
In summary, PFIZER INC shows a case where the two main parts of a technical breakout plan match. Its Technical Rating of 7 confirms it is in a clear uptrend, giving the directional view. Its Setup Rating of 10 shows it is in a time of close pause, offering a possible entry point with a distinct level of risk set by nearby support. While past results and technical patterns are never a promise of future outcomes, this pairing is exactly what technical screens are made to find.
It is key to recall that such patterns need watching, a breakout above resistance on good volume would be required to confirm the pattern. Also, investors should always do their own research, thinking about fundamental points and coming company events like earnings reports that could affect price movement.
For investors wanting to find other stocks now meeting similar technical and pattern conditions, new possible breakout candidates can be found daily using the Technical Breakout Setups screen.
,
Disclaimer: This article is for informational purposes only and does not constitute investment advice, a recommendation, or an offer or solicitation to buy or sell any securities. The analysis is based on technical data and patterns, which are not indicative of future performance. All investing involves risk, including the potential loss of principal. You should conduct your own research and consult with a qualified financial advisor before making any investment decisions.