
A possible breakout setup was detected on P G & E CORP (NYSE:PCG) by our stockscreener. A breakout pattern is formed when a stock consolidates after a strong rise up. We note that this pattern is detected purely based on technical analysis and whether the breakout actually materializes remains to be seen. It could be interesting to keep an eye on NYSE:PCG.
Zooming in on the technicals.
ChartMill assigns a Technical Rating to every stock. This score, ranging from 0 to 10, is updated daily and is determined by evaluating multiple technical indicators and properties.
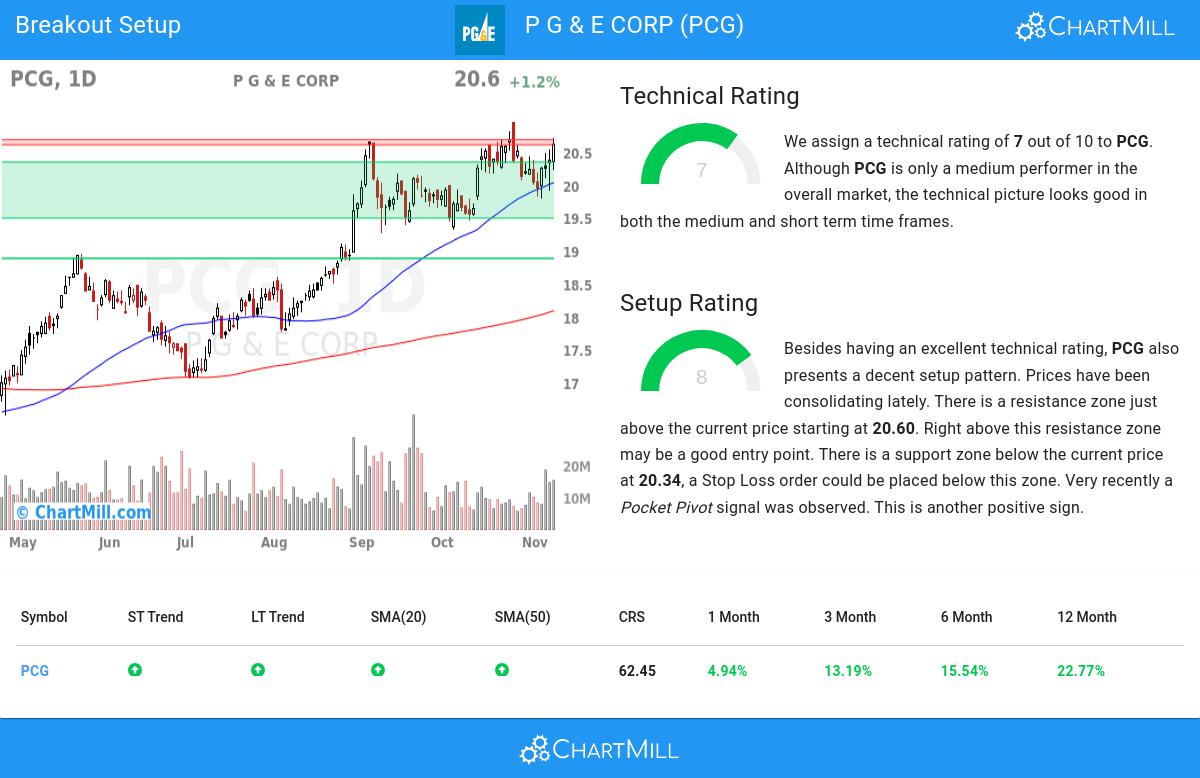
We assign a technical rating of 7 out of 10 to PCG. This is due to a decent performance in both the short and medium term time frames. Compared to the overall market, PCG is only an average performer.
- The long and short term trends are both positive. This is looking good!
- PCG is part of the Electric Utilities industry. There are 47 other stocks in this industry. PCG outperforms 78% of them.
- PCG is currently trading near its 52 week high, which is a good sign. The S&P500 Index however is also trading near new highs, which makes the performance in line with the market.
- When comparing the performance of all stocks over the past year, PCG turns out to be only a medium performer in the overall market: it outperformed 62% of all stocks.
- In the last month PCG has a been trading in a tight range between 19.76 and 20.93.
Our latest full technical report of PCG contains the most current technical analsysis.
How do we evaluate the setup for NYSE:PCG?
Next to the Technical Rating, the Setup Rating of a stock determines to which extend the stock is consolidating. This score also ranges from 0 to 10 and is updated daily. The setup score evaluates various short term technical indicators. For NYSE:PCG this score is currently 8:
Besides having an excellent technical rating, PCG also presents a decent setup pattern. Prices have been consolidating lately. There is a resistance zone just above the current price starting at 20.60. Right above this resistance zone may be a good entry point. There is a support zone below the current price at 20.34, a Stop Loss order could be placed below this zone. Very recently a Pocket Pivot signal was observed. This is another positive sign.
How to trade NYSE:PCG?
For a potential trade one would typically wait until the stock breaks out of the consolidation zone to enter the stock and it could be sold again for a loss when it would fall back below the zone.
Important Note: The content of this article is not intended as trading advice. It is essential to perform your own analysis and exercise caution when making trading decisions. The article presents technical observations generated by automated analysis but does not guarantee any trading outcomes. Always trade responsibly and make independent judgments.
Our Breakout screener lists more breakout setups and is updated daily.
Keep in mind
This article should in no way be interpreted as advice. The article is based on the observed metrics at the time of writing, but you should always make your own analysis and trade or invest at your own responsibility.