
A possible breakout setup was detected on P G & E CORP (NYSE:PCG) by our stockscreener. A breakout pattern is formed when a stock consolidates after a strong rise up. We note that this pattern is detected purely based on technical analysis and whether the breakout actually materializes remains to be seen. It could be interesting to keep an eye on NYSE:PCG.
Technical Analysis Observations
ChartMill utilizes a proprietary algorithm to assign a Technical Rating to every stock. This rating, ranging from 0 to 10, is computed daily by analyzing a variety of technical indicators and properties.
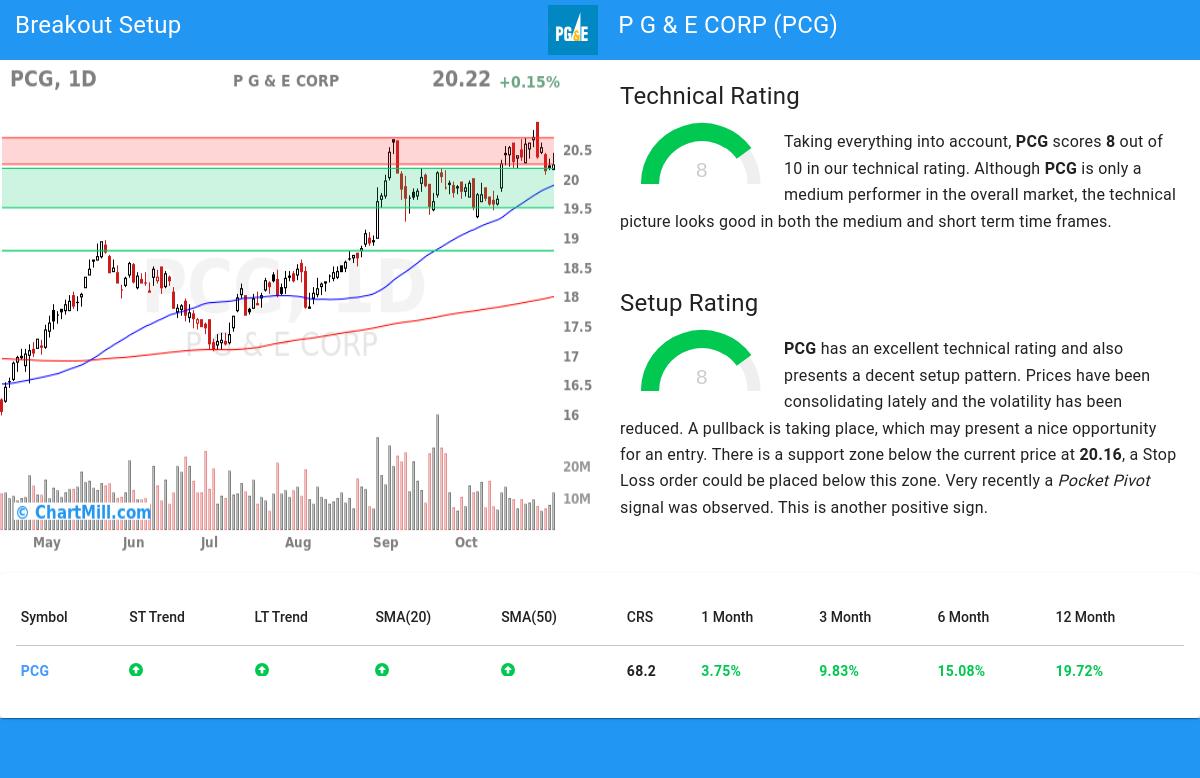
We assign a technical rating of 8 out of 10 to PCG. Although PCG is only a medium performer in the overall market, the technical picture looks good in both the medium and short term time frames.
- The long and short term trends are both positive. This is looking good!
- PCG is one of the better performing stocks in the Electric Utilities industry, it outperforms 80% of 47 stocks in the same industry.
- PCG is currently trading in the upper part of its 52 week range. The S&P500 Index however is currently trading near a new high, so PCG is lagging the market slightly.
- When compared to the yearly performance of all other stocks, PCG outperforms 68% of them, which is more or less in line with the market.
- In the last month PCG has a been trading in the 19.31 - 20.93 range, which is quite wide. It is currently trading in the middle of this range, so some resistance may be found above.
Check the latest full technical report of PCG for a complete technical analysis.
How does the Setup look for NYSE:PCG
Besides the Technical Rating, ChartMill assigns a Setup Rating to every stock to determine the degree of consolidation. This rating, ranging from 0 to 10, is updated daily and evaluates various short-term technical indicators. NYSE:PCG currently holds a 8 as its setup rating, suggesting a particular level of consolidation in the stock.
PCG has an excellent technical rating and also presents a decent setup pattern. Prices have been consolidating lately and the volatility has been reduced. A pullback is taking place, which may present a nice opportunity for an entry. There is a support zone below the current price at 20.16, a Stop Loss order could be placed below this zone. Very recently a Pocket Pivot signal was observed. This is another positive sign.
Trading breakout setups.
For a potential trade one would typically wait until the stock breaks out of the consolidation zone to enter the stock and it could be sold again for a loss when it would fall back below the zone.
Of course, there are many ways to trade or not trade NYSE:PCG and this article should in no way be interpreted as trading advice. The article is purely based on an automated technical analysis and just points out the technical observations. Always make your own analysis and trade at your own responsibility.
More breakout setups can be found in our Breakout screener.
Disclaimer
This article should in no way be interpreted as advice. The article is based on the observed metrics at the time of writing, but you should always make your own analysis and trade or invest at your own responsibility.