
Investors looking to find high-potential growth stocks frequently use systematic methods that join strict technical and fundamental analysis. One noted method is the plan created by Mark Minervini, which centers on finding stocks in strong uptrends that also have improving business fundamentals. This method uses a specific "Trend Template" to sort for technically sound stocks and combines it with a search for high-growth momentum, making sure candidates are both trending and showing the earnings and sales growth seen in market leaders. This two-step filtering process tries to find stocks set for major moves by matching price strength with the company's actual performance.
Phibro Animal Health Corp-A (NASDAQ:PAHC), a company that creates and sells animal health and mineral nutrition products, recently appeared from a screen built on this idea. The screen used Minervini's Trend Template to confirm a solid technical base and then filtered for a high growth momentum (HGM) rating to check for fundamental strength. We will look at how PAHC meets these standards.
Technical Fit with the Minervini Trend Template
The center of Minervini's plan is to invest in strength, staying away from stocks in consolidation or falling stages. The Trend Template gives a strict list to find stocks in a confirmed Stage 2 advance. PAHC's present chart shows a clear fit with these technical rules:
- Trading Above Key Averages: The stock price is above its rising 50-day, 150-day, and 200-day simple moving averages (SMAs). This stacked order shows continued buying interest across short, intermediate, and long-term periods.
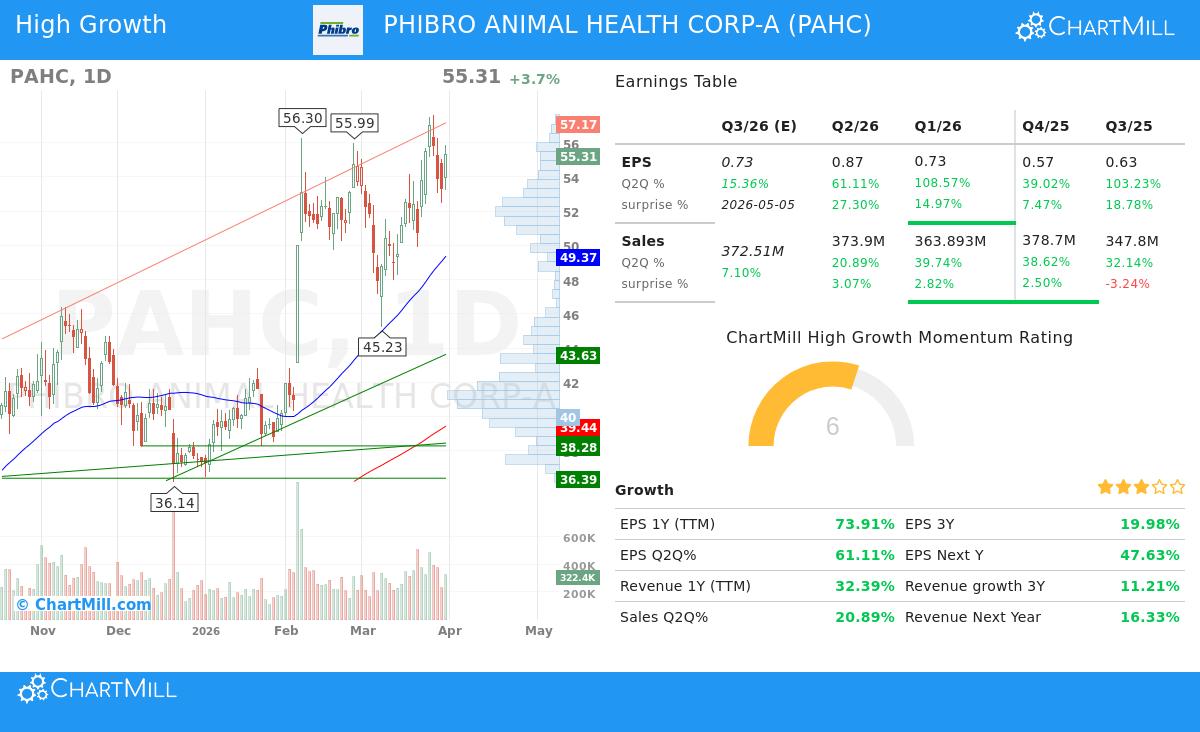
- Moving Average Order: The 50-day SMA ($49.37) is above both the 150-day SMA ($43.12) and the 200-day SMA ($39.44), and the 150-day SMA is also above the 200-day SMA. This sequence confirms a strong and orderly uptrend.
- Near Highs: A main point of the strategy is to focus on strength, not low price. PAHC's current price is within 4% of its 52-week high of $57.62, showing leadership and momentum. At the same time, it is more than 240% above its 52-week low, confirming a strong recovery trend is already in place.
- High Relative Strength: With a ChartMill Relative Strength (CRS) score of 96.75, PAHC is doing better than nearly 97% of all stocks in the market over the last year. Minervini notes that real market leaders regularly show high relative strength, as it points to institutional buying and better performance compared to similar companies.
This technical view meets the Trend Template's main goal: to make sure an investor only looks at stocks where the likely direction is clearly higher, thus improving the chances for success.
Fundamental Strength and High Growth Momentum
While the Trend Template deals with the "when" to buy, Minervini's full plan requires a strong "why" based in fundamentals. The screen's HGM filter looks for companies showing improving financial results, a sign of possible top performers. PAHC's recent financial reports show several high-growth traits:
- Strong Earnings Growth: The company is experiencing major earnings improvement.
- Trailing Twelve-Month (TTM) EPS has increased by about 74%.
- Recent quarterly year-over-year EPS growth has been very strong, with the last two quarters showing rises of 108.6% and 61.1%.
- This momentum is seen in analyst views, with the average EPS estimate for the next fiscal year raised by more than 10% in the last three months.
- Solid and Improving Revenue: Top-line growth supports continued earnings expansion.
- TTM revenue has risen by over 32%.
- Recent quarterly sales growth has been solid, with numbers of 39.7%, 38.6%, and 32.1% over the past three comparable quarters.
- Growing Profitability: The company is not just increasing sales but is turning more of that revenue into profit. The profit margin in the last reported quarter was 7.34%, showing a step-by-step gain and a major recovery from the previous fiscal year's margin of 0.24%.
- Steady Performance: PAHC has surpassed consensus EPS estimates in each of the last four quarters, with an average beat of over 17%. This record of beating forecasts builds trust and can be a reason for more institutional attention.
For a high-growth investor, this mix of improving earnings, solid sales growth, expanding margins, and positive estimate changes is exactly the fundamental picture wanted. It indicates the company is taking market share, enhancing operations, and pleasing analysts, factors that often come before continued upward moves in the stock price.
Technical Condition and Setup Review
Beyond the specific Trend Template standards, a wider view of PAHC's technical condition is positive. According to ChartMill's own analysis, the stock gets a perfect Technical Rating of 10/10, reflecting high strength across many timeframes and measures. The long-term and short-term trends are both seen as positive, and the stock is a clear leader in the Pharmaceuticals industry, doing better than 91% of its peers.
The technical report also mentions a good setup rating, with prices having moved in a somewhat wide band over the last month. While the stock is near the top of this band, the analysis shows very little price resistance above, indicating a possible way for continued progress if the stock can make a clear breakout. A full list of the support levels and technical details is available in the full technical report for PAHC.
A Stock for More Review
Phibro Animal Health Corp-A shows a strong example of a stock that meets the two requirements of a strict growth and momentum plan. It passes the exact technical filters of the Minervini Trend Template, confirming it is in a strong, confirmed uptrend. Also, its fundamental picture displays the high-growth momentum shown by strong earnings growth, solid sales improvement, and gaining profitability.
For investors using this method, PAHC is the kind of stock that justifies a spot on a watchlist for more careful study, including a review of its industry situation, competitive place, and specific chart patterns for possible entry points.
Interested in locating other stocks that meet this mix of strong trends and high growth? You can use the same screening process with the High Growth Momentum + Trend Template screen on ChartMill.
Disclaimer: This article is for information and learning only. It is not a suggestion to buy or sell any security. The analysis is based on given data and described screening methods. All investors should do their own complete research and think about their personal money situation and risk comfort before making any investment choice. Please read our full disclaimer here.