
In the search for returns that exceed the market, many investors use systematic plans that join strict technical and fundamental study. One highly regarded method is the SEPA® plan created by noted trader Mark Minervini. This plan centers on finding stocks with high possibility already in solid upward trends, backed by strong earnings and sales momentum. By using a fixed "Trend Template" for technical condition and filtering for "High Growth Momentum" in company foundations, investors try to find leaders before they make their largest price moves. This two-step method tries to match price strength with business speed, telling real candidates from general market activity.
Ovid Therapeutics Inc (NASDAQ:OVID) appears as a present candidate that meets this detailed filtering process, showing a picture that may draw growth-oriented investors using an orderly, momentum-centered plan.
Technical Match with the Minervini Trend Template
The main part of Minervini's entry rules is the Trend Template, a group of firm technical guidelines made to confirm a stock is in a clear, solid uptrend. OVID's present chart form shows a strong match with these guidelines:
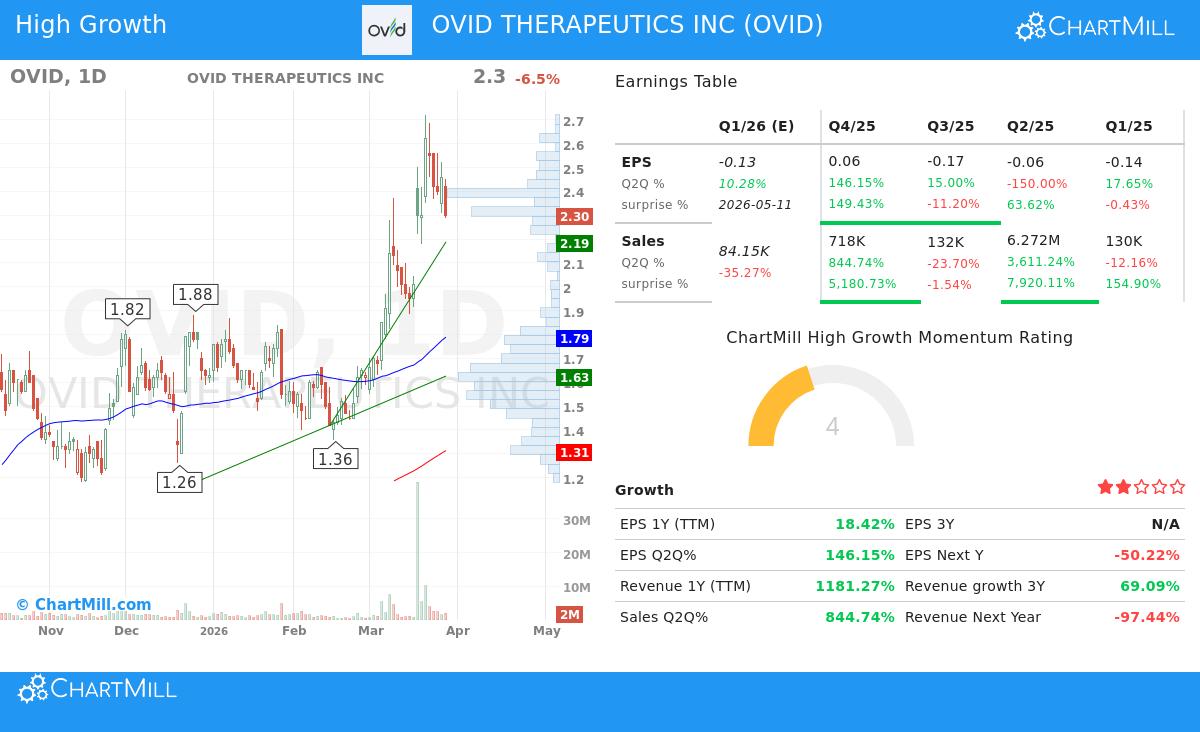
- Price Above Important Moving Averages: The stock's last price of $2.30 trades well above its rising 50-day ($1.79), 150-day ($1.58), and 200-day ($1.31) simple moving averages. This ordered position shows continued buying across all main time periods.
- Positive Moving Average Directions and Order: Importantly, these averages are not flat lines but are all moving upward. The 50-day average is positioned above both the 150-day and 200-day averages, and the 150-day is above the 200-day. This step-by-step positive order is a clear sign of a stock in a solid "Stage 2" climb, a period Minervini highlights for gaining most of a trend's profit.
- Nearness to Highs: OVID's price is about 849% above its 52-week low of $0.24, greatly passing the template's 30% requirement and showing large recovery momentum. At the same time, it trades within 15% of its 52-week high of $2.72, meeting the "within 25%" rule that centers on leadership and strength instead of slower, low-priced stocks.
- Better Relative Strength: With a ChartMill Relative Strength (CRS) score of 99.35, OVID does better than almost all other stocks in the market. Minervini regularly notes that the largest gainers show better relative strength early, as it points to institutional buying and market leadership.
Fundamental Speed for High Growth Momentum
While a solid chart is necessary, Minervini's plan requires that technical strength be supported by fundamental speed. The "High Growth Momentum" part of the filter looks for companies showing strong, and often getting better, growth paths in earnings and sales. OVID's recent financial numbers show several high-growth signs:
- High Top-Line Growth: The company's revenue growth on a trailing twelve-month (TTM) basis is at a very high 1,181%. Even more notable is the newest quarterly sales growth, which rose 845% year-over-year. This type of speed can work as a strong catalyst, drawing investor notice and pushing new valuations.
- Earnings Speed: On the bottom line, OVID shows clear progress. EPS growth for the last quarter increased 146% compared to the same quarter last year. While the company is still in a development stage (with a TTM EPS of -$0.31), the large drop in losses and positive earnings surprise history, beating estimates in two of the last four quarters by an average of 50%, hints at a possible turning point.
- Cash Flow Progress: Supporting the earnings direction, the company's free cash flow per share has gotten better by 32% over the past year. For a biopharmaceutical company, handling cash use while moving a pipeline forward is important, and positive movement here is a good sign.
This pairing of climbing revenue and quickly improving earnings directions is exactly what the High Growth Momentum filter tries to find. Minervini's study shows that "large earnings draw large notice," and even for biotech firms before profit, huge revenue speed and improving margins are main drivers of investor feeling and stock price.
Technical Condition and Present Position
Beyond the fixed Trend Template, a wider technical study of OVID shows a solid picture. ChartMill gives the stock a high Technical Rating of 9 out of 10, seeing its strong positive directions across both short and long-term periods. The stock is doing better than 97% of its peers in the Biotechnology industry, further confirming its leadership place inside a competitive field.
However, the study also gives a word of care for immediate entry. The Setup Quality rating is now a 3, showing that while the stock's trend is very good, its recent price movement has been changeable. The stock has traded in a wide band over the past month ($1.55 - $2.72) and is presently near the top of that band. For users of the Minervini plan, this hints the stock may not be in a perfect "volatility squeeze" shape for a low-risk entry. The advice would usually be to wait for a narrower consolidation or a move back toward important support levels, found near $2.19 and $1.62, to form a more good risk/reward position.
You can see the full, detailed technical study for OVID on its ChartMill Technical Report page.
Conclusion
Ovid Therapeutics Inc shows a strong example of a stock that fits the ideas of momentum investing. It meets the strict technical list of the Minervini Trend Template, showing clear leadership through its price action, moving average order, and better relative strength. Fundamentally, it shows the type of high revenue growth and positive earnings speed that High Growth Momentum filters are made to find, suggesting a fundamental catalyst behind the technical rise.
For investors using this plan, OVID stands for a possible leader being formed. The important point, as usual, is in orderly action: waiting for a correct, lower-changeability position to form before starting a trade, using fixed stop-losses to handle the natural risk of a clinical-stage biotech, and setting the trade size correctly inside a varied portfolio.
Interested in finding more stocks that meet this mix of solid trends and high growth? You can run the "High Growth Momentum + Trend Template" filter yourself to see present market candidates by clicking here.
Disclaimer: This article is for information and learning only. It is not a suggestion to buy or sell any security. The study is based on given data and does not form investment advice. All investing includes risk, including the possible loss of original money. You should do your own study and talk with a qualified financial advisor before making any investment choices.