
For investors who use chart patterns and momentum to inform their choices, a methodical way to locate possibilities is important. One technique filters for stocks that show good technical condition and are making a constructive price pattern, a pairing that can indicate a possible price move. This method centers on two specific scores from ChartMill: the Technical Rating, which measures the general condition and direction of a stock, and the Setup Quality Rating, which evaluates if the stock's recent price movement is settling into a good point for entry. The aim is to find leading stocks that are resting before their next possible upward move.
Oceaneering International Inc (NYSE:OII), a company that provides engineered services and robotic solutions to the offshore energy and other sectors, is now a clear example of this kind of formation. The company's stock has been a strong performer, and a close technical examination indicates it may be preparing for its next action.
A Base of Technical Condition
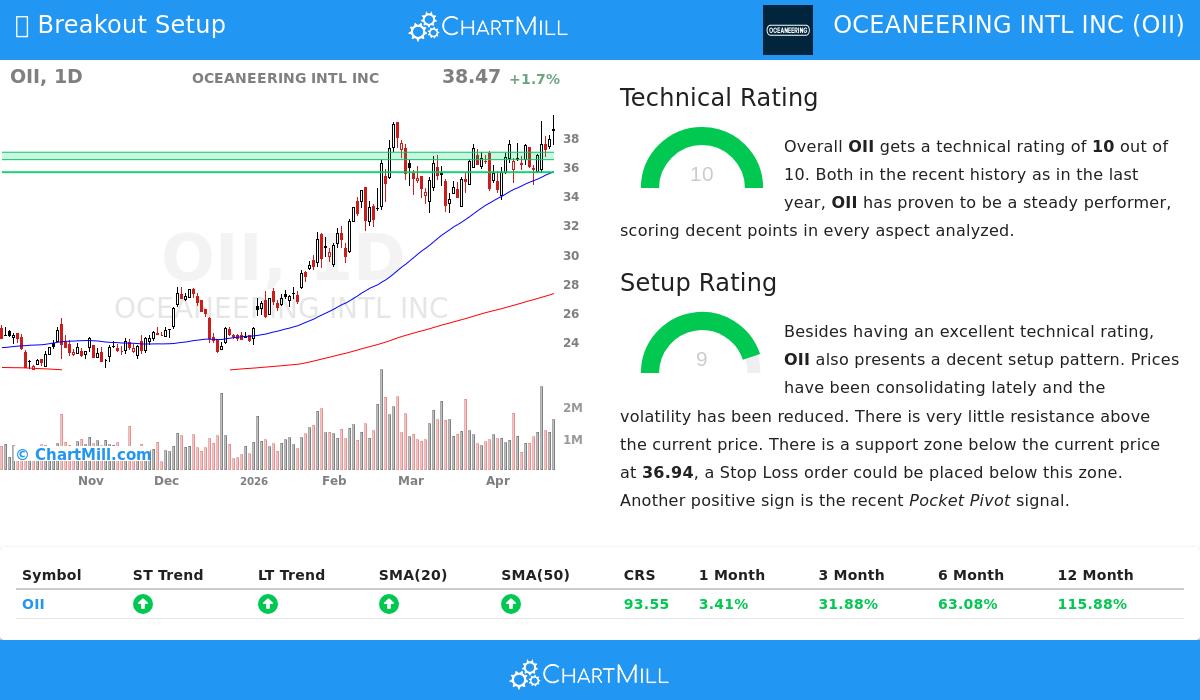
The first part of this breakout method is finding stocks with good underlying direction. Oceaneering International does very well here, receiving a complete ChartMill Technical Rating of 10 out of 10. This highest score shows very good technical condition across various time periods and measures.
A detailed view of the full technical report shows the reasons for this high rating:
- Strong Direction Agreement: Both the longer-term and shorter-term directions for OII are marked as positive, a matched optimistic sign that offers good support.
- Market-Leading Results: The stock is doing better than 93% of all stocks in the market over the last year, with increases that have been steady over that time. It is also trading at a new 52-week high, a traditional mark of condition.
- Optimistic Moving Average Arrangement: The stock is trading above all its main simple moving averages (20, 50, 100, and 200-day), and each of these averages is itself in an upward arrangement. This ordered agreement is a sign of a continued upward direction.
- Sector Position: Inside the active Energy Equipment & Services field, OII performs better than 63% of similar companies, verifying its condition is not only broad-market based but also specific to its sector.
This very good technical rating speaks directly to the method's central question of "which stock?" It confirms OII is a market leader with momentum clearly in its favor, giving a firm base for any possible trade.
A Good Setup for Entry
A firm direction by itself is not a signal to buy; entering at a high price can be dangerous. This is where the Setup Quality Rating becomes important, answering the method's "when?" question. Oceaneering International gets a 9 out of 10 here, showing a very good consolidation pattern.
The examination highlights several elements that make the present chart structure interesting for breakout traders:
- Consolidation Inside a Band: Over the last month, OII has traded between $33.64 and $39.49. It is now testing the top edge of this band, a common position before a breakout.
- Lowered Volatility & Clear Support: The report mentions lowered volatility during this consolidation period, often a sign before a notable move. More significantly, a clear support area has been formed between $36.43 and $36.94, created by a combination of trendlines and moving averages. This gives a reasonable area to set a protective stop-loss order.
- Positive Volume Sign: A recent "Pocket Pivot" sign was seen, a pattern that implies buying by larger participants as the price increases on higher-than-normal volume. This can be an early, quiet confirmation of buying activity.
- Little Overhead Resistance: With the stock at new highs, there is very little chart-based resistance above the present price, which could permit a clear upward path if a breakout continues.
A Specific Trading Plan
Based on this technical and setup examination, a possible trade plan is created. It proposes an entry on a buy-stop order at $39.50, just above the recent band high, to confirm the breakout is starting. The proposed exit (stop-loss) is set at $36.42, just under the noted support area. This establishes a risk of about $3.08 per share, or 7.8%. For a portfolio manager, this means risking 1% of total capital by assigning roughly 12.8% to this position. It is very important to note that this is an example created from the technical measures; investors must modify any setup to match their own risk comfort and method.
Locating Additional Possibilities
Oceaneering International shows the kind of possibility the Technical Breakout screen is made to find. For traders looking for a daily list of stocks displaying similar pairings of firm directions and tight consolidations, the screen is operated regularly. You can see the present results and look at other possible breakout formations by going to the Technical Breakout Setups screen.
Disclaimer: This article is for information only and does not form investment advice, a suggestion, or an offer or request to buy or sell any securities. The examination shown is based on technical measures and past data, which are not assurances of future results. Investing includes risk, including the possible loss of principal. Always do your own investigation and think about talking with a qualified financial advisor before making any investment choices. The automated trade setup explained is for example only.