
For investors who use technical analysis to find possible trades, a common method looks for stocks that show solid technical signals and are ready to move out of a period of sideways trading. This method tries to join momentum with timing, with the goal of entering a stock as it starts a new upward move after a pause. An organized method to do this uses filters that look for stocks with strong technical condition numbers and high pattern quality numbers, which measure these two important parts.
Omega Healthcare Investors (NYSE:OHI), a real estate investment trust (REIT) in the long-term healthcare field, recently appeared from such a filter. The company, which gives capital and financing to skilled nursing and assisted living facilities, is now showing a price pattern that technical traders may find interesting.
Looking at Technical Condition
The base of a breakout method is first confirming the stock is in a clear upward trend. A stock in a downward trend or a weak sideways pattern has a lower chance of holding a good breakout. Omega Healthcare Investors shows very good technical condition, as described in its ChartMill Technical Report.
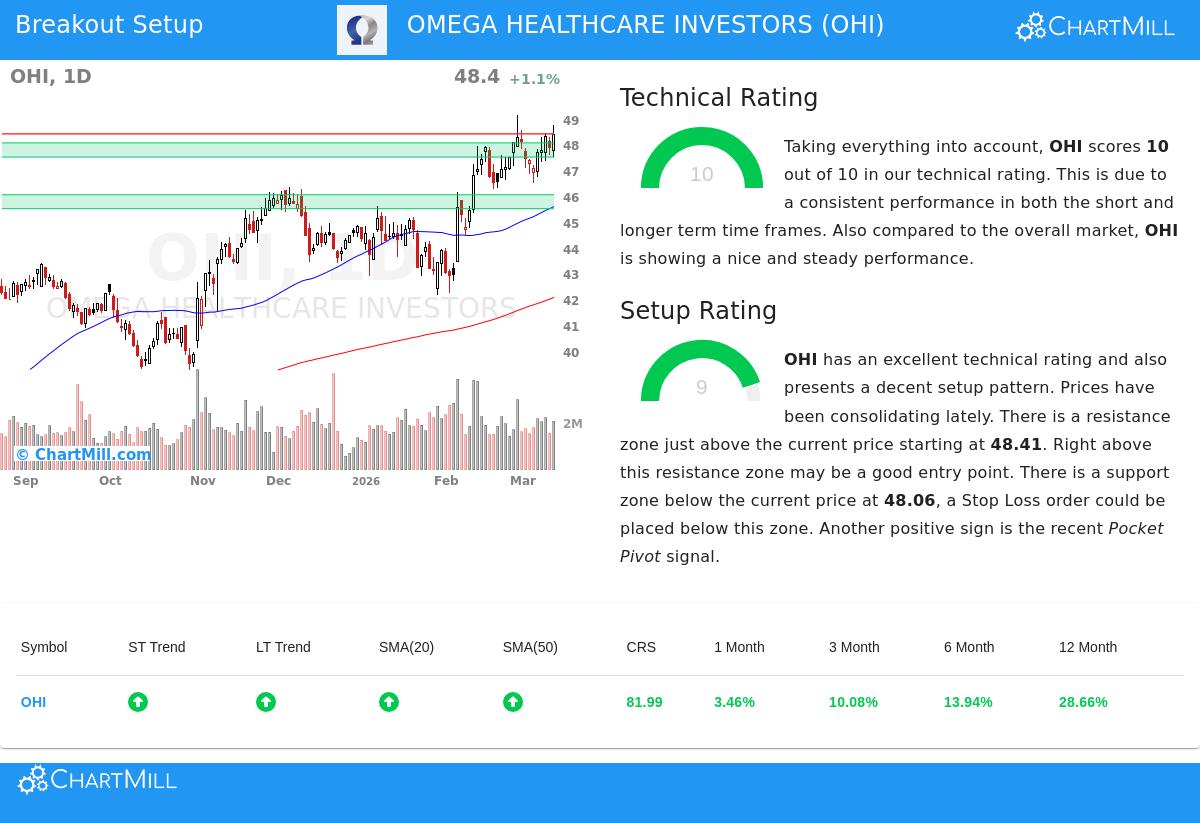
The report gives OHI a top Technical Rating of 10 out of 10, showing very good technical health. This number comes from a review of several time periods and performance compared to the market. Important parts that lead to this high rating are:
- Positive Trend Agreement: Both the long-term and short-term trends for OHI are rated as positive. This agreement across time periods points to a steady and maintainable upward move, which is a main trait looked for by trend-based methods.
- Good Performance Compared to Market: The stock is doing better than the wider market. It is trading close to its 52-week high while the S&P 500 is not, showing it is a leader. Also, OHI has done better than 90% of similar companies in the Diversified REITs field over the last year.
- Supportive Price Averages: The stock's price is trading above all its main simple moving averages (20, 50, 100, and 200-day), and each of these averages is itself in a rising pattern. This stacked order of moving averages is a standard sign of upward momentum.
This solid technical foundation is important because it raises the chance that any breakout from a sideways pattern will lead to a follow-through of the existing uptrend, not a false signal or a turn lower.
Reviewing the Pattern Quality
While technical condition finds which stock to watch, pattern quality deals with when to think about an entry. A high-quality pattern usually shows as a time of sideways trading or base-forming, where price movement narrows and the stock trades in a tight band. This makes a clear level of support and a specific point where a breakout can be verified.
OHI gets a 9 out of 10 on the Pattern Quality rating. The review shows that over the last month, the stock has been trading in a band between $46.28 and $49.14 and is now moving sideways in the middle of this band. More exactly, the pattern shows these traits:
- Clear Resistance and Support: The technical report finds a definite resistance area just above the present price, starting at $48.41. At the same time, a support area exists below, from $47.51 to $48.06. This creates a well-marked trading band.
- Sideways Trading Near Highs: The fact that this sideways action is happening near 52-week highs is usually seen as a positive sign, suggesting the stock is pausing before trying to move up.
- Supporting Trade Volume Signal: A recent "Pocket Pivot" signal was seen, which is a price and volume pattern often linked to buying by large investors. This can add confidence to the possibility of an upward move.
For a breakout trader, this structure allows for a careful method: an entry order can be set just above the marked resistance level ($48.41) to verify the breakout, with a protective stop-loss order set just below the nearby support area. The quality of the pattern is judged by how clearly these levels are marked, and OHI's chart now gives that clarity.
A Specific Trading Example
From this review, the technical report presents a sample trading plan. It suggests an entry at $48.42 (a buy-stop order above resistance) with an exit stop-loss at $47.50 (below support). This sets a risk of about 1.9% on the trade itself. It is very important to know this is an automated example for demonstration. Individual traders must change such details based on their own risk comfort, position size plans, and review of the wider market situation, where the S&P 500's long-term trend is now negative.
Locating Other Chances
The pairing of a top Technical Rating (10) and a high Pattern Quality number (9) is what drew technical filters to Omega Healthcare Investors. For investors wanting to search for other stocks showing similar breakout potential, this method is used each day in the Technical Breakout Setups filter.
Disclaimer: This article is for information only and is not investment advice, a suggestion, or an offer to buy or sell any security. The trading example given is automated and for demonstration. Always do your own research, think about your financial position and risk comfort, and talk with a qualified financial advisor before making any investment choices. Past results do not guarantee future outcomes.