
For technical investors, finding stocks that are in a solid uptrend and ready for their next rise is an important strategy. One technique looks for securities that show both good technical condition and a helpful consolidation pattern, hinting at a possible breakout. This method uses a high "Technical Rating," which measures the force and durability of a stock's trend, and a high "Setup Quality Rating," which evaluates the narrowness of recent trading and the existence of a defined entry point. The aim is to locate market leaders that are in a short rest period before possibly moving upward again.
A recent search using this technique has pointed to The New York Times Co. (NYSE:NYT) as a candidate for more review. The media company's stock seems to match the standards for a technical breakout setup, offering an interesting chart formation for traders who watch price movement.
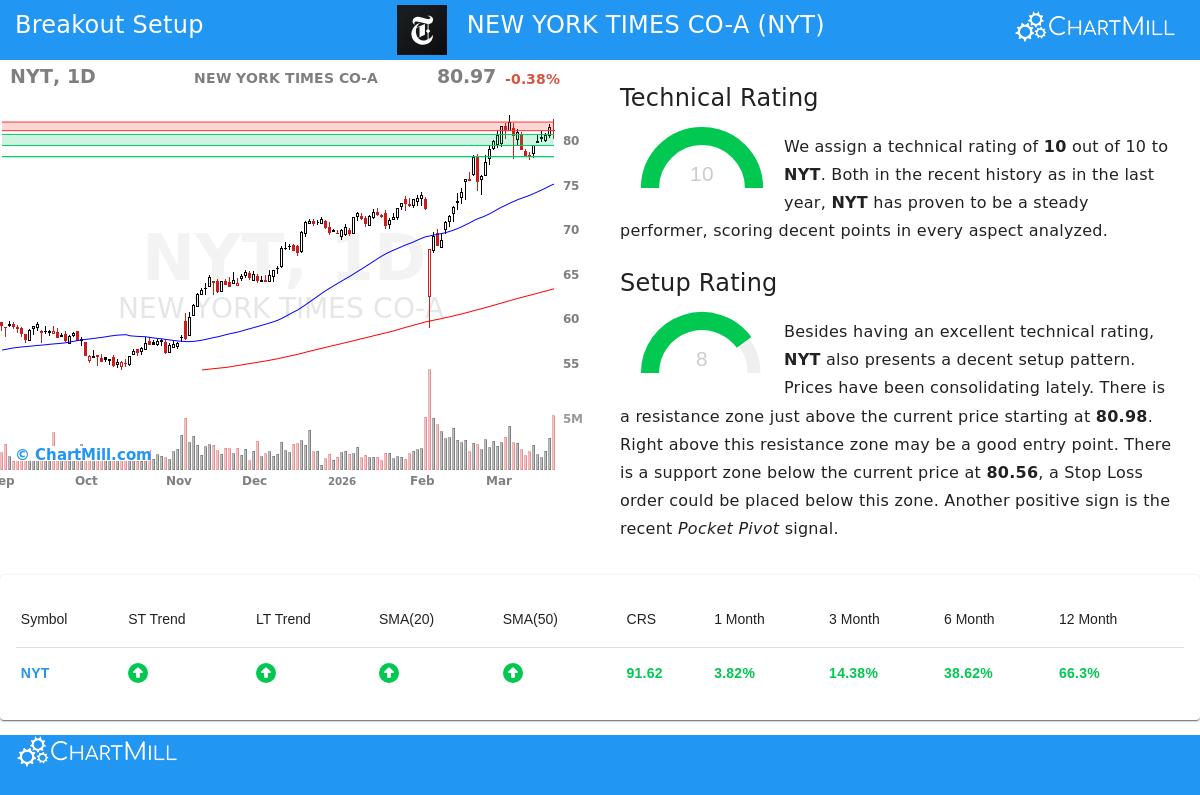
Technical Strength: A High-Level Rating
The base of a breakout trade is a stock with existing momentum and trend force. The New York Times Co. does very well here, receiving a top ChartMill Technical Rating of 10. This high mark puts it with the market's best performers from a technical view. A close look at the technical report shows several points backing this rating:
- Trend Direction: Both the long-term and short-term trends for NYT are marked as up. This agreement across periods points to a unified and strong price move.
- Market and Industry Position: The stock is doing better than 91% of all stocks in the market over the last year and holds the same leading spot within its media industry group of 92 companies. It is now trading close to its 52-week high, while the wider S&P 500 is not, showing it is ahead of the market, not just tracking it.
- Moving Average Backing: The stock price is above all its main simple moving averages (20, 50, 100, and 200-day), and each average is rising. This layered structure of support is a standard trait of a good uptrend.
- Solid Relative Performance: The stock's relative strength number of 91.62 verifies that its price increase has been notable and steady compared to most other stocks.
For the breakout plan, this high technical rating is essential. It answers the first important question: "Is this a stock in a solid, confirmed uptrend?" For NYT, the information strongly says yes.
Setup Quality: A Pause Before the Possible Advance
A forceful trend by itself does not give the best entry; buying after a fast, long climb can result in quick declines. This is where the Setup Quality Rating is key, dealing with the question of "when" to enter. NYT now has a Setup Rating of 8, meaning it is making a helpful pattern.
The technical report states that prices have been moving sideways recently, seen as the stock trades in a fairly narrow band near its highs. This rest lets the stock absorb its earlier increases and form a foundation for its next possible climb. The setup is made clearer by defined, close levels a technical trader can use to plan a trade:
- Resistance and Entry: A specific resistance area is found between $80.98 and $81.95. A clear move above this area could mark the restart of the uptrend and work as a reasonable entry signal.
- Support and Risk Control: Below the present price, a notable support area sits between $79.31 and $80.56, made by a combination of trendlines and moving averages. This gives a clear zone below which to set a stop-loss order, specifying the trade's risk.
- Additional Signals: The report also mentions a recent "Pocket Pivot" signal, a volume-related pattern that hints at buying by larger investors during the sideways movement, adding another piece of positive information.
The pairing of a high technical rating and a high setup rating is what marks a real breakout candidate. It shows a strong stock that is pausing, giving a disciplined trader a specific, rule-guided chance to join its next possible upward move.
A Specific Trading Plan
Using the analysis of support and resistance, the technical report proposes a possible trade plan. It describes an entry point just above the resistance area at $81.96, with a stop-loss order set below the support area at $79.30. This would cap the maximum risk on the trade to about 3.25%. It is very important to note this is an automatic example for learning. Traders must always do their own study, change settings to match their individual risk comfort, and know about coming company events like earnings reports.
Locating Other Chances
The New York Times Co. is one case found through a methodical search process. For investors wanting to find other stocks that now display high technical and setup ratings, the Technical Breakout Setups screen is refreshed each day to show a new list of possible candidates.
Disclaimer: This article is for information only and is not investment advice, a suggestion, or an offer to buy or sell any security. The trading example given is automatic and for illustration. You should perform your own research and talk with a qualified financial advisor before making any investment choices. Investing has risk, including the possible loss of your initial investment.