
For investors who use charts and price action to guide their choices, a methodical way to find opportunities is important. One approach looks for stocks that are both technically sound and creating a particular price formation. This plan centers on two main parts: first, finding stocks that are in a clear uptrend, and second, spotting those that are resting their gains in a narrow band, which frequently comes before the next upward move. By merging these two filters, a high technical health score and a high setup quality score, traders can create a short list of possible breakout candidates.
Northern Oil and Gas Inc (NYSE:NOG) recently appeared from such a search, showing a profile that calls for more examination from a technical viewpoint.
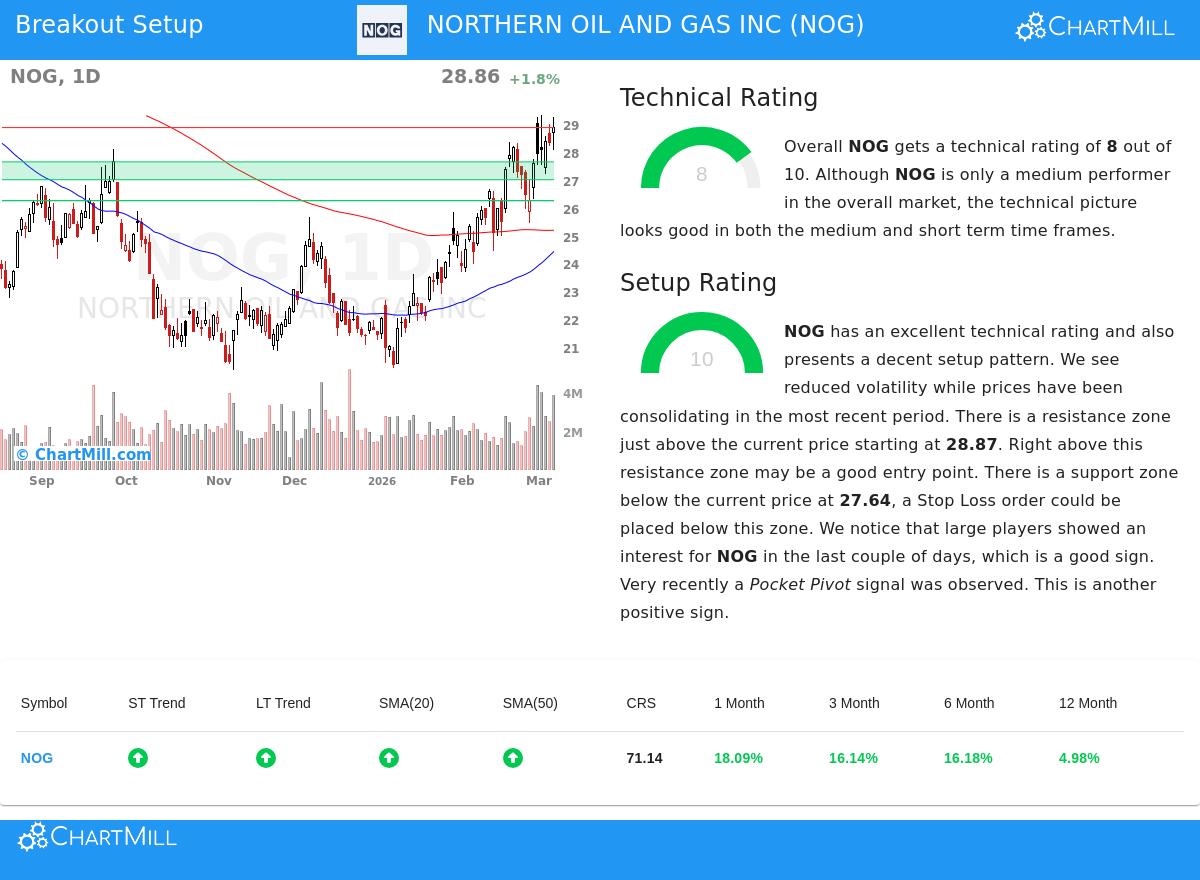
Technical Strength: The Base of the Trend
The first part of this breakout plan is confirming the stock is in a sound uptrend. This is not about a brief one-day rise but a maintained move backed by multiple timeframes and measures. According to its ChartMill Technical Analysis report, NOG receives a good technical rating of 8 out of 10. This number is important because it combines several positive signals into one, measurable value.
- Trend Agreement: Both the near-term and longer-term trends for NOG are rated as positive. This agreement across timeframes is a strong signal, showing momentum is not only a recent event but part of a bigger, confirmed move.
- Moving Average Backing: The stock’s price is trading above all its main simple moving averages (20, 50, 100, and 200-day), and each of these averages is itself in a rising pattern. This makes a series of changing support levels below the price.
- Relative Performance: While the report states NOG is a medium performer compared to the whole market and trails some similar companies in its field, its recent performance has been solid. The stock has recorded good increases over the past one, three, and six-month periods, showing its ability for upward movement.
This technical soundness is important for the plan because it raises the chance that any breakout from a resting formation will continue in the direction of the main trend, instead of stopping or turning down.
Setup Quality: The Form of the Resting Period
A strong trend by itself is not a signal to buy; entering after a fast rise holds notable risk. The second part of the plan is finding a high-grade setup, which usually appears as a time of resting or basing. This is where NOG really is notable, having a perfect setup quality rating of 10.
The technical report lists the traits that add to this top score:
- Lowered Volatility & Narrow Trading: The report states "lowered volatility while prices have been resting in the most recent period." NOG has been trading between $24.46 and $29.32 over the past month, and it is now near the top of this band. This coiling action often comes before a clear move.
- Clear Support and Resistance: A well-formed setup needs clear limits. The analysis finds a support area between $27.00 and $27.64, made by a meeting of trendlines and moving averages. Just above, a resistance area is noted at $28.87. This creates a clear point for the next directional move.
- Supportive Market Action: Adding more confidence, the report points out positive activity signals. There has been noticeable interest from large participants (as measured by the Effective Volume indicator), and a "Pocket Pivot" signal, a specific positive price/volume formation, was recently seen. These elements suggest large-scale accumulation may be happening within the resting period.
A high setup rating is key because it gives a trader a clear, lower-risk plan: set an entry point just above resistance to confirm the breakout, and place a protective stop-loss just below the defined support area. This form allows for careful risk management.
A Specific Trading Plan
Based on this examination, the technical report proposes a possible trade form that shows the breakout plan:
- Entry: A buy stop order at $28.88, placed just above the noted resistance at $28.87 to confirm a breakout.
- Exit (Stop-Loss): A sell stop order at $26.99, placed just below the main support area to limit downside risk.
- Risk/Reward: This setup would involve a risk of about 6.5% on the trade itself.
It is important to state that this is an example made from the technical measures. The report itself warns that the space between the entry and exit is relatively small compared to the stock's average daily movement, and traders should always do their own examination to decide if these levels fit their personal risk comfort and plan.
Finding More Possibilities
The process that found NOG can be used methodically to the wider market. For technical investors looking for other possible breakout setups that meet these strict needs of strong trends and high-grade resting periods, new results are produced daily.
You can find the present list of qualifying stocks by visiting the Technical Breakout Setups screen.
Disclaimer: This article is for information only and does not make up investment advice, a suggestion, or an offer to buy or sell any security. The examination shown is based on technical data and automated reports. All investing and trading includes risk, including the possible loss of principal. Readers should do their own research, think about their individual money situation, and talk with a qualified financial advisor before making any investment choices. Past results are not a guide for future results.