
Quality investing is not about searching for the cheapest stocks or timing the market. Instead, it focuses on buying shares in well-run businesses with lasting competitive advantages, strong profitability, and a proven ability to grow efficiently over the long term. One screening method designed to find such companies is the “Caviar Cruise” strategy, which applies a strict set of fundamental filters. The idea is to identify firms that not only produce consistent revenue and profit growth but also have high returns on invested capital, manageable debt, and the ability to turn accounting profits into real cash flow. When we ran this screen, one name that came up was Nasdaq Inc (NASDAQ:NDAQ), the company behind one of the world’s largest stock exchanges. Below, we will go through why this particular stock fits the traits that long-term, quality-focused investors look for.
Revenue and Profit Growth
At the center of the Caviar Cruise screen is the need for both revenue and operating profit to grow at least 5% each year over the past five years. This is not random: a quality business should be increasing its top line, but it is even more important that profitability keeps up or speeds up. Nasdaq passes both tests with extra room. Its revenue compound annual growth rate (CAGR) over the last five years is 6.80%, comfortably above the 5% mark. More importantly, its EBIT (earnings before interest and taxes) grew at a much faster 12.49% CAGR during the same period. This gap between revenue growth and EBIT growth is a clear sign that the company is not just growing, but doing so more efficiently—likely gaining from economies of scale or pricing power.
Profitability and Return on Invested Capital
Quality investors place great importance on how well a company uses its capital. The Caviar Cruise screen specifically looks for a return on invested capital excluding cash, goodwill, and intangibles (ROICexgc) of at least 15%. Nasdaq’s number here is an exceptional 123.45%, far above the minimum. Such a high figure suggests the exchange operator needs very little capital to produce its earnings, a mark of a business with strong intangible assets and a wide economic moat. This measure is central to the strategy because a company that can regularly reinvest its profits at high rates of return is likely to increase shareholder value over many years.
Debt and Cash Flow Quality
No matter how profitable a company looks on paper, quality investors also focus on the balance sheet and the reality of cash generation. The screen filters for a Debt-to-Free Cash Flow ratio below 5, meaning the firm could theoretically pay off all its debt in less than five years using its current free cash flow. Nasdaq’s ratio of 4.53 fits comfortably within that range, showing a manageable debt load compared to its cash generation ability.
Additionally, the strategy checks for “profit quality” by measuring the average ratio of free cash flow to net income over the past five years, with a minimum threshold of 75%. Here, Nasdaq scores 125.43%, meaning it actually turns more of its accounting net income into hard cash than the net income figure would suggest. This is a good sign: it implies the company’s earnings are not being used up by large non-cash charges or aggressive accounting, and that management can reinvest or return that cash to shareholders.
Dividend and Shareholder Returns
While not a strict filter in the base screen, the strategy’s focus on financial health naturally leads to companies that can afford to reward shareholders consistently. Nasdaq has raised its dividend for at least ten straight years, with an annual growth rate of 10.18%. The current payout ratio of 33.61% is sustainable, meaning the company keeps plenty of earnings to fund growth while still returning capital to investors. This combination of growing dividends and low payout risk fits well with the buy-and-hold philosophy of quality investing.
Analyst Estimates and Future Growth
The more advanced version of the Caviar Cruise screen also requires analysts to expect revenue growth of at least 5% over the next three years. Nasdaq meets this, with consensus estimates pointing to 6.80% annual top-line expansion. Furthermore, earnings per share are projected to grow at around 11.95% each year over the next few years. While future estimates are never guaranteed, this forward-looking data supports the idea that the underlying trends—such as the shift to electronic trading, data services, and market infrastructure—remain strong.
Fundamental Rating at a Glance
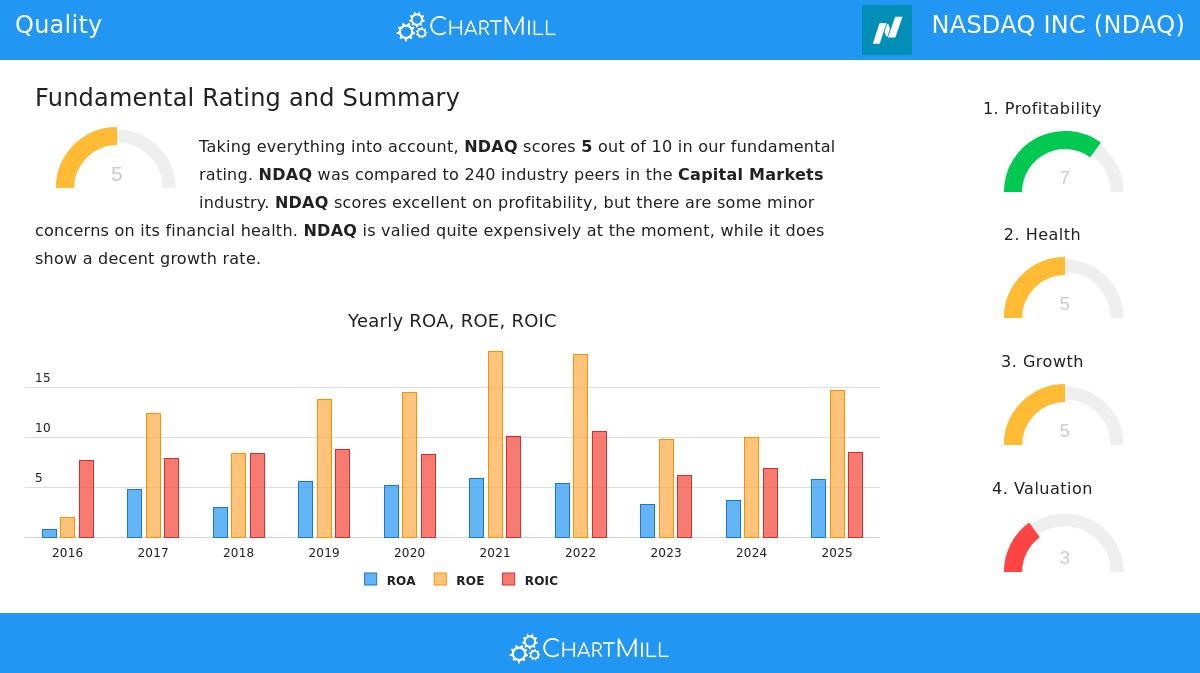
Our complete fundamental analysis of NDAQ gives the stock a score of 5 out of 10. This overall rating reflects a mixed picture: the company scores very well on profitability (7/10) and shows decent growth metrics (5/10), but receives lower marks for valuation (3/10) and financial health (5/10). In simple terms, Nasdaq is a high-quality business with excellent margins and a strong competitive position, but it trades at a premium—its P/E ratio of 23.85 is above the industry average. That said, the strategy is designed to first identify quality, and then requires the investor to decide whether the price is fair. For those willing to pay more for proven performance, Nasdaq’s fundamentals provide plenty of confidence.
More Results from the Screen
The Caviar Cruise screen is designed to narrow the universe of thousands of stocks down to a select group of companies that show the core traits of quality investing. While Nasdaq passed the test, it is by no means the only stock meeting these criteria. If you are interested in looking at additional companies that fit this quality-focused framework, you can view the full list of current Caviar Cruise screen results here.
Disclaimer: This article is for informational and educational purposes only and does not constitute investment advice. Always conduct your own research and consider your financial situation before making any investment decisions.