
NORWEGIAN CRUISE LINE HOLDIN (NYSE:NCLH) was identified as a Technical Breakout Setup Pattern by our stockscreener. Such a pattern occurs when we see a pause in a strong uptrend: after a strong rise the stock is consolidating a bit and at some point the trend may be continued. Whether this actually happens can not be predicted of course, but it may be a good idea to keep and eye on NYSE:NCLH.
Zooming in on the technicals.
As part of its analysis, ChartMill provides a comprehensive Technical Rating for each stock. This rating, ranging from 0 to 10, is updated on a daily basis and is based on the evaluation of various technical indicators and properties.
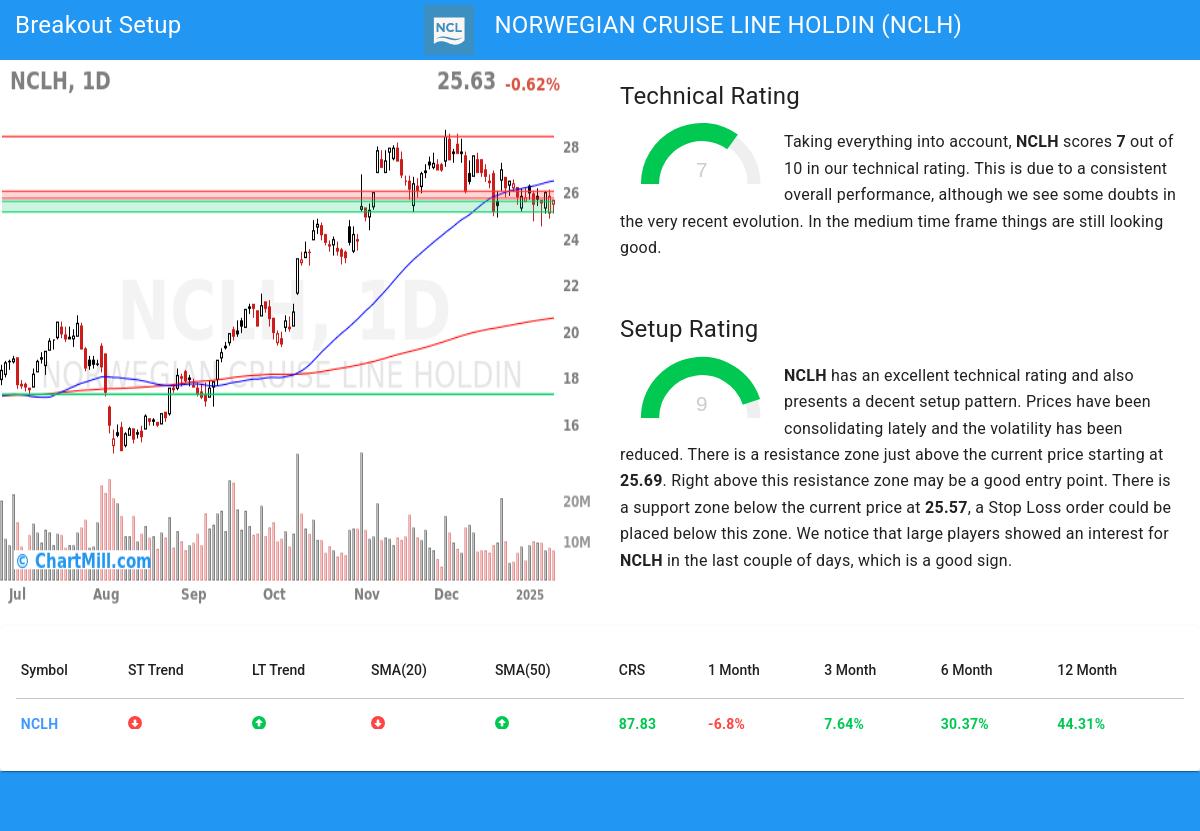
Overall NCLH gets a technical rating of 7 out of 10. This is due to a consistent overall performance, although we see some doubts in the very recent evolution. In the medium time frame things are still looking good.
- Looking at the yearly performance, NCLH did better than 87% of all other stocks. We also observe that the gains produced by NCLH over the past year are nicely spread over this period.
- NCLH is one of the better performing stocks in the Hotels, Restaurants & Leisure industry, it outperforms 79% of 134 stocks in the same industry.
- NCLH is currently trading in the upper part of its 52 week range. The S&P500 Index is also trading in the upper part of its 52 week range, so NCLH is performing more or less in line with the market.
- The short term trend is negative, but the long term trend is still positive. So although the long term is still positive, this may be a trend turning.
Our latest full technical report of NCLH contains the most current technical analsysis.
Why is NYSE:NCLH a setup?
Alongside the Technical Rating, ChartMill assigns a Setup Rating to evaluate the consolidation level of a stock. This rating, ranging from 0 to 10, is updated daily and considers various short-term technical indicators. The current setup rating for NYSE:NCLH is 9:
Besides having an excellent technical rating, NCLH also presents a decent setup pattern. Prices have been consolidating lately and the volatility has been reduced. There is a resistance zone just above the current price starting at 25.69. Right above this resistance zone may be a good entry point. There is a support zone below the current price at 25.57, a Stop Loss order could be placed below this zone. We notice that large players showed an interest for NCLH in the last couple of days, which is a good sign.
Trading setups like NYSE:NCLH
One strategy to consider is waiting for the actual breakout to occur, where the stock breaks out above the current consolidation zone. Traders can then enter a buy position, anticipating further upward momentum. As a risk management measure, it is advisable to set a stop loss order below the consolidation zone.
Please note that this article should not be construed as trading advice. The information provided is solely based on automated technical analysis and serves to highlight technical observations. It is important to conduct your own analysis and make trading decisions based on your own judgment and responsibility.
More breakout setups can be found in our Breakout screener.
Keep in mind
This is not investing advice! The article highlights some of the observations at the time of writing, but you should always make your own analysis and invest based on your own insights.