
For investors who use charts and price action to make choices, the search often comes to two key questions: which stock is in a strong trend, and when is the right time to buy it? A systematic way to answer these questions involves looking for stocks that combine sound technical condition with a high-grade consolidation pattern, indicating a possible breakout. This method centers on entering a stock as it leaves a phase of narrow trading, seeking to take part in the next segment of a confirmed uptrend.
One stock now found on such scans is ALTRIA GROUP INC (NYSE:MO), the tobacco and nicotine products company behind brands like Marlboro and Copenhagen. Based on a recent technical analysis report from ChartMill, Altria offers a noteworthy case for technical investors searching for a defined setup.
A Base of Technical Condition
The first part of a breakout method is finding a stock with basic technical condition, confirming the larger trend is positive. Altria’s ChartMill Technical Rating of 7 out of 10 shows a stock in a verified uptrend. This number comes from a multi-part study of price trends, moving averages, and relative performance. Important technical good points for MO include:
- Both its near-term and longer-term trends are scored as positive, giving agreement across various time frames.
- The stock is priced above its main moving averages (50-day, 100-day, and 200-day), which are all in upward arrangements.
- It shows firm relative performance, doing better than 71% of all stocks over the last year and placing well inside its sector.
This basic condition is key because it raises the chance that any breakout from consolidation will keep going in the direction of the existing trend, instead of stopping or turning down.
A High-Grade Setup for a Possible Breakout
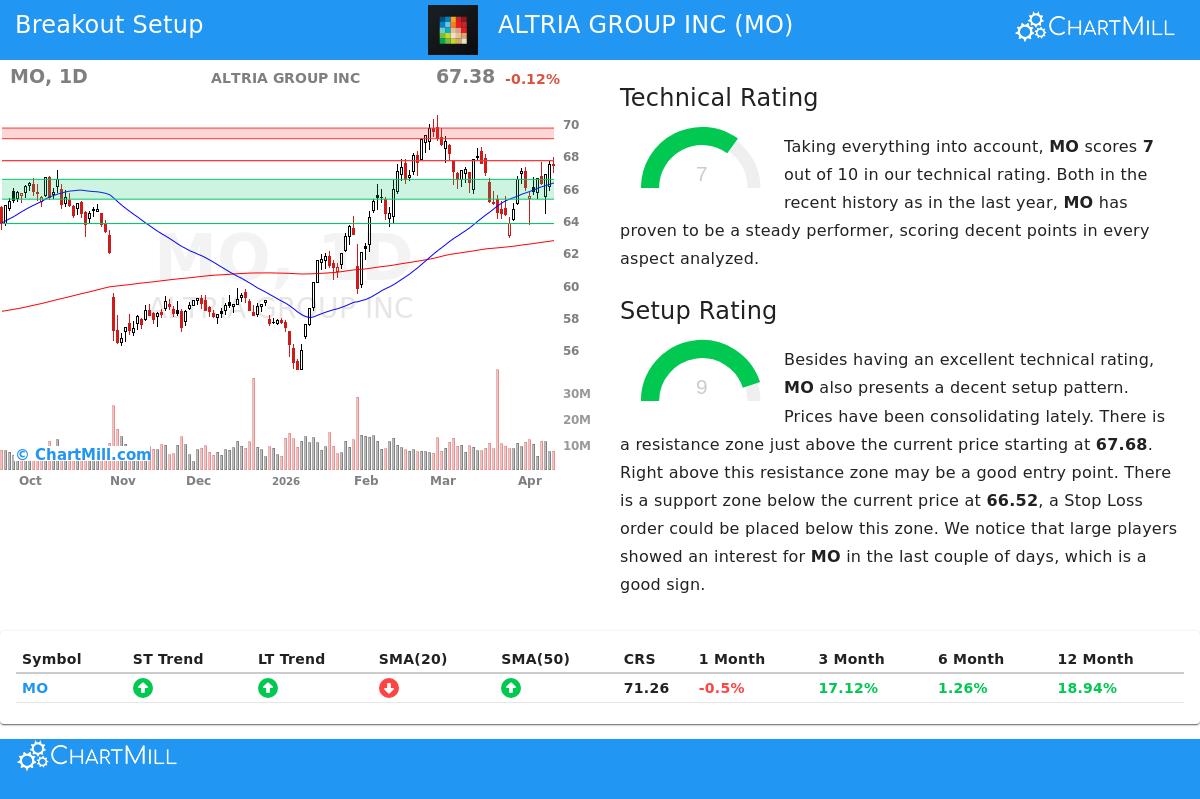
While a strong trend is needed, it is not enough for a best entry. A stock that has risen quickly can be "stretched," making it likely to decline. This is where the grade of the setup becomes critical. Altria stands out here, getting a near-top Setup Rating of 9 out of 10. This score measures how narrowly a stock has been trading lately, searching for phases of consolidation that frequently come before a new price move.
The technical report points out that MO has been consolidating inside a band over the last month, trading between about $62.87 and $68.55. This price tightening, paired with falling volatility, forms a clear structure with specific support and resistance points. For a trader, this gives a reasoned plan:
- A Specific Entry Point: Resistance is noted just above the present price at $67.68. A breakout above this point could be seen as a sign that the consolidation has finished and the uptrend is starting again.
- A Reasoned Stop-Loss: A firm support area exists between $65.29 and $66.52. Setting a protective stop-loss order below this area helps outline and cap the trade's risk if the breakout does not hold.
Also, the report mentions greater buying activity from bigger market players in recent days, which can sometimes act as a confirming signal before a possible move.
Viewing the Setup in Context
The automated study based on these technical and setup ratings indicates a specific, though example, trading plan. It suggests an entry on a buy-stop order at $67.69 (just above resistance) with an exit stop at $65.28 (below support). This would mean a defined risk of about 3.56% on the trade. It is a standard example of how the mix of a firm Technical Rating (the "which") and a top Setup Rating (the "when") can turn into a workable plan.
Altria’s present technical picture, a stock in a steady uptrend taking a break to form a base, makes it a prospect for investors watching for breakout chances. As usual, this technical setup should be weighed next to fundamental points and wider market state.
For traders looking for more chances that match this systematic breakout model, new prospects are found each day. You can see the current list of technical breakout setups by going to the Technical Breakout Setups screen.
Disclaimer: This article is for information only and does not form investment advice, a suggestion, or an offer or request to buy or sell any securities. The analysis shown is based on technical indicators and automated reports, which are not assurances of future results. All trading and investment choices include risk, including the possible loss of principal. Readers should do their own study and talk with a qualified financial advisor before making any investment choices.