
For investors watching chart patterns and price movement, a methodical way to locate prospects involves searching for stocks that show both good technical condition and a forming pattern that may lead to an advance. The process uses two specific scores from ChartMill: the Technical Rating, which measures the general condition and direction of a stock, and the Setup Quality Rating, which finds times of sideways movement that might come before a new price rise. A good Technical Rating confirms the main direction is positive, while a good Setup Rating indicates the stock is moving in a limited range, giving a more specific entry point with understood risk. This two-step method seeks to find possible breakout stocks within the group of market leaders.
Altria Group Inc (NYSE:MO) recently appeared from such a search, showing a profile that fits these technical conditions. The tobacco company, with products like Marlboro cigarettes and Copenhagen smokeless tobacco, is now displaying a mix of good trend condition and a positive price formation, making it a stock for those watching charts to study.
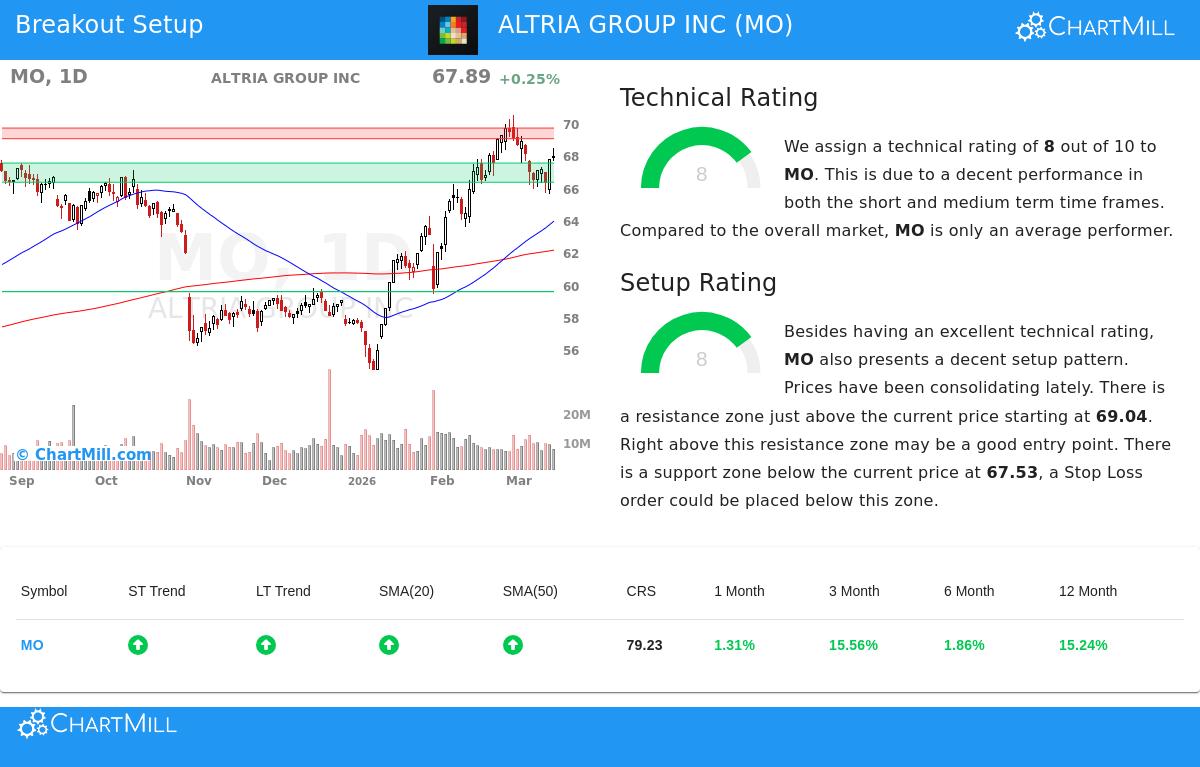
Technical Condition and Trend State
The base of any breakout trade is a stock with inherent condition, which is exactly what the Technical Rating tries to assess. Altria receives a good Technical Rating of 8 out of 10, showing a stock in good technical shape within a confirmed upward direction. This score is not given easily; it shows positive movement across several time periods and important moving averages.
A closer study of the technical report shows the sources of this condition:
- Positive Trend Agreement: Both the near-term and longer-term trends for MO are marked as positive. This agreement is a strong sign, indicating movement is favorable across different investor timeframes.
- Place Compared to Important Averages: The stock is priced above all its main simple moving averages (20, 50, 100, and 200-day), and each of these averages is itself in a rising state. This arrangement shows a healthy, controlled rise.
- Good Comparative Performance: While the wider S&P 500 deals with a negative longer-term trend, MO has been a noticeable performer. It is trading in the higher part of its 52-week range and has done better than about 79% of all stocks over the last year, showing clear comparative condition in a difficult market.
This good technical foundation is key for the breakout plan. It makes sure that if a breakout happens, the stock is more probable to keep moving in the direction of its set, strong trend instead of reversing quickly.
Setup Quality and Sideways Formation
A strong trend by itself is not a signal to buy; entering after a fast increase involves high risk. This is where the Setup Quality Rating becomes important, as it finds times when a stock is resting and gathering force for its next move. Altria scores an 8 here too, indicating a good-quality sideways period.
The technical study explains the character of this formation:
- Bull Flag Pattern: The report specifically states that MO is now showing a bull flag formation. This is a standard continuation pattern where prices decline slightly in a small, downward channel after a strong rise, looking like a flag on a pole.
- Specific Support and Resistance: The sideways movement is contained by clear levels. There is a support area marked between $66.34 and $67.53, made by a meeting of moving averages and trendlines. Just above, a resistance area lies between $69.04 and $69.70.
- Contained Price Movement: The high Setup Rating confirms that recent trading has been fairly contained and sideways. This lowering movement within the flag pattern is what creates a possible scenario with defined risk and reward, as a breakout above resistance gives a clear signal with a close level to set a protective stop-loss order.
The existence of this good-quality formation directly answers the "when" to buy. It supplies a precise, chart-based idea: wait for a clear move above the resistance area to confirm the bull flag breakout, with a stop-loss order set below the support area to control risk.
A Specific Trading Plan
From this study, the technical report presents a sample trading plan. It suggests an entry on a breakout above the resistance at $69.71, with a stop-loss set at $66.33, just under the important support area. This would create a risk of about 4.85% on the trade itself. It is very important to know this is an example created from the chart patterns; investors must always adjust entry, exit, and trade size to their own risk comfort and plan.
The mix of a high Technical Rating and a high Setup Quality Rating makes Altria an interesting candidate for technical investors searching for breakout chances. It shows a strong trend resting in a known pattern, preparing for a possible next rise.
Find more possible breakout formations each day by visiting the Technical Breakout Setups screen.
,
Disclaimer: This article is for information only and is not investment advice, a suggestion, or an offer or request to buy or sell any securities. The study is based on technical measures and past data, which are not promises of future results. Investing has risk, including the possible loss of the amount invested. Always do your own research and think about your money situation and risk comfort before making any investment choices.