
Our stock screener has identified ALTRIA GROUP INC (NYSE:MO) as a potential breakout candidate. This technical breakout setup pattern occurs when the stock consolidates after a strong uptrend. While the actual breakout is uncertain, it may be worth keeping an eye on NYSE:MO.
Insights from Technical Analysis
ChartMill assigns a Technical Rating to every stock. This score, ranging from 0 to 10, is updated daily and is determined by evaluating multiple technical indicators and properties.
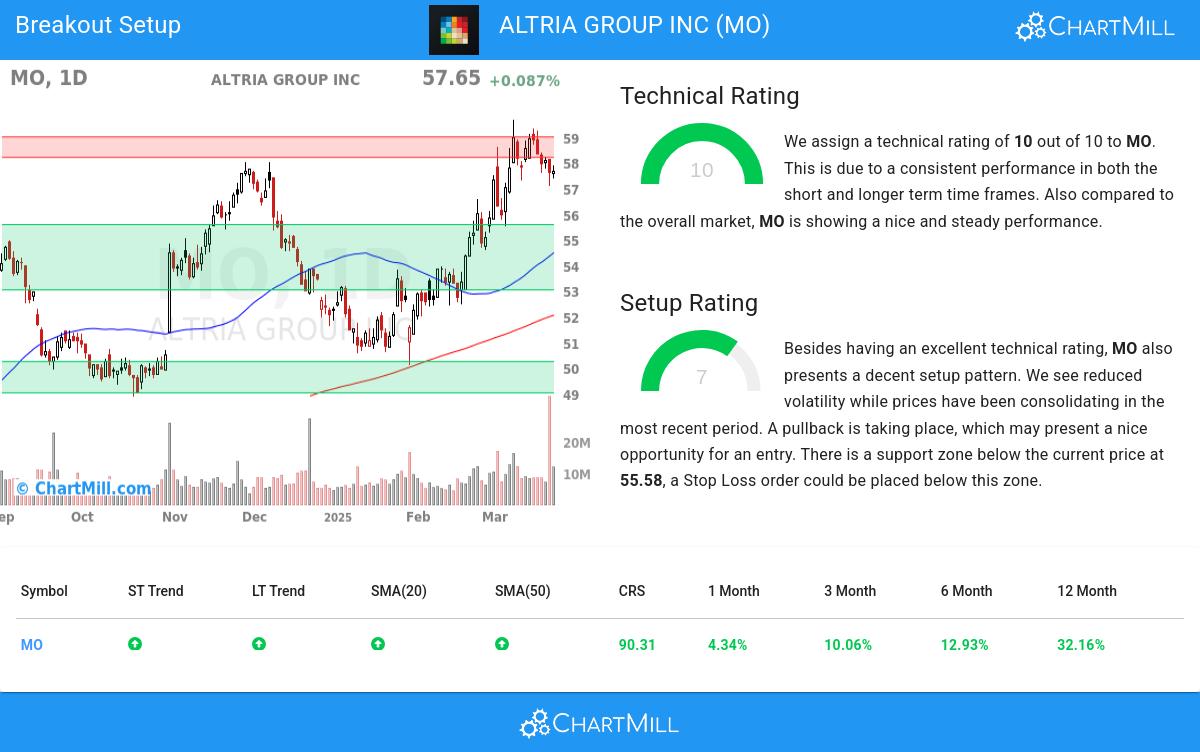
Overall MO gets a technical rating of 10 out of 10. This is due to a consistent performance in both the short and longer term time frames. Also compared to the overall market, MO is showing a nice and steady performance.
- The long and short term trends are both positive. This is looking good!
- Looking at the yearly performance, MO did better than 90% of all other stocks. On top of that, MO also shows a nice and consistent pattern of rising prices.
- MO is currently trading in the upper part of its 52 week range. The market is still in the middle of its 52 week range, so MO slightly outperforms the market at the moment.
- MO is currently showing a bull flag pattern! A bull flag pattern occurs when prices pull back slightly after a strong rise up. This may be a nice opportunity for an entry.
- Volume is considerably higher in the last couple of days, which is what you like to see during a strong movement up.
- MO is an average performer in the Tobacco industry, it outperforms 57% of 8 stocks in the same industry.
Our latest full technical report of MO contains the most current technical analsysis.
How does the Setup look for MO
Besides the Technical Rating, ChartMill also assign a Setup Rating to every stock. This setup score also ranges from 0 to 10 and determines to which extend the stock is consolidating. This is achieved by evaluating multiple short term technical indicators. MO currently has a 7 as setup rating:
Besides having an excellent technical rating, MO also presents a decent setup pattern. We see reduced volatility while prices have been consolidating in the most recent period. A pullback is taking place, which may present a nice opportunity for an entry. There is a support zone below the current price at 55.58, a Stop Loss order could be placed below this zone.
Trading setups like MO
A breakout could materialize when the stock breaks out to new highs above the current consolidation zone. One could wait for this to happen and buy when this happens. A stop loss could be placed below the consolidation zone.
Disclaimer: This article is not intended to provide trading advice. It is crucial to conduct your own analysis and consider your own observations and trading style when making investment decisions. The article solely presents technical observations and should not be relied upon as a sole basis for trading.
Every day, new breakout setups can be found on ChartMill in our Breakout screener.
Disclaimer
This is not investing advice! The article highlights some of the observations at the time of writing, but you should always make your own analysis and invest based on your own insights.