
In the world of growth investing, combining a solid technical framework with strict fundamental analysis can be a strong method for finding possible market leaders. One organized method that represents this thinking is the strategy made famous by trader Mark Minervini. His method depends on the "Trend Template," a group of technical rules made to find stocks in strong, confirmed uptrends. This is then combined with a look at high-growth fundamentals, companies showing speeding earnings, solid sales growth, and positive analyst changes. The aim is to find stocks that are both technically sound and supported by outstanding business speed, giving a combination of parts that have come before large price gains.
LAM RESEARCH CORP (NASDAQ:LRCX) comes forward as a candidate that seems to fit this two-part strategy. As a top provider of semiconductor processing equipment, the company is central to the global technology supply chain. A check of its technical and fundamental picture suggests it deserves more study from investors using a growth and speed-based framework.
Checking the Technical Base: The Minervini Trend Template
The Minervini Trend Template is made from exact, fixed technical conditions meant to sort for stocks in a clear Stage 2 rise. Let's check how Lam Research measures against these main rules:
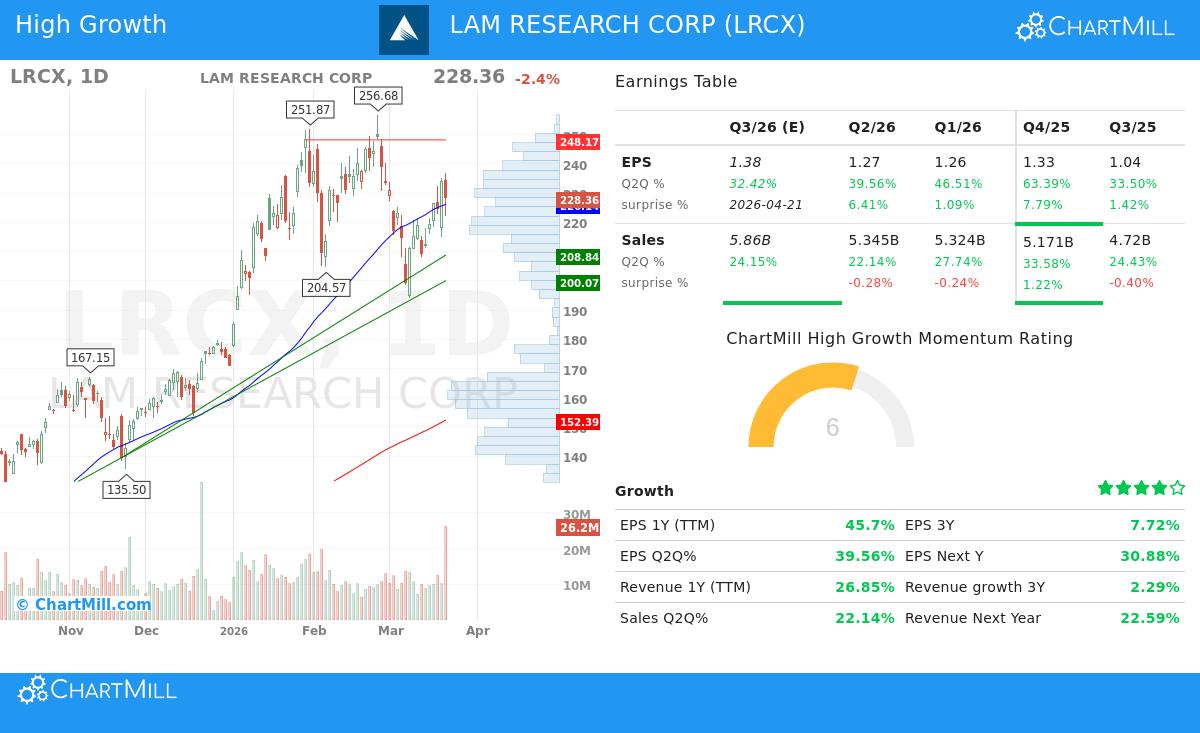
- Price Compared to Moving Averages: The present price of $228.36 is much higher than the rising 150-day SMA (~$170.92) and the 200-day SMA (~$152.39). This meets the main rules of being above these long-term averages, confirming the stock is in a long-term positive phase.
- Moving Average Order & Direction: The 50-day SMA (~$226.14) is above both the 150-day and 200-day SMAs. Also, the 150-day SMA is above the 200-day SMA, and importantly, the 200-day SMA itself is in a confirmed uptrend, having moved up from about $151.67 to its present value. This ordered, rising line of averages is a classic sign of solid institutional buying and kept upward speed.
- Nearness to 52-Week Highs/Lows: LRCX's price is now about 201% above its 52-week low of $56.32, well past the "30% above" limit and showing strong recovery speed. While the stock is about 11% below its 52-week high of $256.68, it stays inside the planned limit of focusing on stocks close to their highs, staying away from those in deep resting patterns.
- Relative Strength: With a ChartMill Relative Strength (CRS) score of 97.9, LRCX is doing better than nearly 98% of the whole market. This outstanding relative strength is a key part of the Minervini method, which looks for market leaders, not poor performers. It shows that money is moving into LRCX faster than into the wider market, even during times of general market doubt.
In summary, Lam Research Corp satisfies the central technical list of the Trend Template, showing a chart marked by a solid long-term uptrend, correct moving average setup, and leader-level relative performance.
Checking the Growth Driver: Fundamentals for Speed
A technically flawless chart is only part of the story for a high-growth speed strategy. The price movement must be backed by getting better business fundamentals. Minervini's study shows that the largest stock market winners almost always show solid earnings and sales growth before their most rapid price moves. Here, LRCX's financial numbers show a strong growth story:
- Earnings Speed Increase: The company is showing clear signs of earnings speed. Quarterly EPS growth (year-over-year) has been solid and speeding up in recent times, with the last two quarters showing about 46.5% and 39.6% growth, in order. This design of high, following growth is a main feature looked for by growth investors.
- Steady Earnings Surprises: LRCX has topped analyst EPS guesses in each of the last four quarters, with an average beat of over 4%. This steady skill to go past hopes builds trust with investors and can lead to positive guess changes.
- Positive Analyst Changes: Maybe one of the most hopeful signals is the direction in analyst feeling. Over the past three months, the average guess for next year's EPS has been changed upward by about 9.6%, and sales guesses have been raised by 5.3%. These upward changes are a strong catalyst, as they often show better visibility and belief in the company's future outlook, drawing more institutional buying.
- Solid Profitability: The company keeps good and steady profit margins, with the last reported quarter showing a net margin near 30%. This shows price strength and operational skill even during a time of large growth.
These fundamental parts, speeding earnings, steady beats, and rising analyst guesses, give the "why" behind the solid technical price action. They suggest the uptrend is built on a base of real business strength, fitting exactly with the high-growth speed part of the strategy.
Technical Condition and Setup Grade
Beyond the exact Trend Template filters, ChartMill's own analysis gives a wider view of the stock's technical condition. Lam Research now holds a high Technical Rating of 9 out of 10, confirming its place as one of the technically soundest stocks in the market. The report states its long-term trend is positive and that it has been a top performer over the past year.
However, the analysis also gives a note of tactical care. The Setup Quality Rating is now a 5. This shows that while the long-term trend is outstanding, the stock's recent price movement has been a bit unstable and it is not now forming a tight, low-risk resting pattern perfect for a new entry. The report proposes waiting for a time of steadiness or a move back to a set support level before thinking about a position. Main support areas are found between $208-$212 and near $199, which could give future areas of interest if tested.
For a full breakdown of the support and resistance levels, moving average analysis, and full technical notes, you can study the complete ChartMill Technical Report for LRCX.
Finding Like Chances
Lam Research Corp gives a case study in a stock that fits a controlled growth and speed strategy, meeting rules for both technical trend strength and fundamental growth speed increase. Investors looking to search for like chances that meet the Minervini Trend Template and show high-growth speed features can study the preset screen used in this analysis.
You can find more possible candidates by using this High Growth Momentum + Trend Template screen on ChartMill.
Disclaimer: This article is for information and learning only. It is not a suggestion to buy or sell any security. The analysis is based on given data and certain method frameworks, and past results are no promise of future results. Always do your own full study and think about your personal money situation and risk comfort before making any investment choices. Please read our full disclaimer here.