
For investors aiming to achieve notable price gains, a mixed method of fundamental and technical study can be an effective plan. The aim is to find firms with solid core business expansion—firm and increasing profits and sales—while also finding a good technical time for purchase. This technique searches for shares where the fundamental narrative points to extended-horizon possibility, and the price chart shows a probable conclusion to a period of sideways movement and the start of a fresh rising direction. A "technical breakout" from this kind of formation frequently marks a change in market feeling and can come before a time of continued price action.
One share presently matching this mixed study structure is LPL Financial Holdings Inc (NASDAQ:LPLA). As the country's biggest independent broker-dealer, LPLA offers a united system of technology, brokerage, and consulting services to financial advisors all over the United States. This places the firm in the middle of the increasing shift toward independent financial guidance and asset management.
Fundamental Strength: The Engine for Growth
The heart of this plan depends on finding firms with excellent growth measures, backed by acceptable financial condition and earnings to confirm durability. LPLA’s fundamental picture, as shown in its ChartMill Fundamental Analysis Report, displays notable positives in this area.
- Outstanding Growth Measures: LPLA receives a high Growth Rating of 8 out of 10. The firm has shown forceful enlargement, with Revenue increasing 37.18% over the last year and at a mean yearly speed of 23.68% over recent years. More significantly, this sales growth is converting to net income, with Earnings Per Share (EPS) increasing by 21.76% last year.
- Fair Price for Growth: Even with this firm performance, the share does not seem expensive. With a Price/Earnings (P/E) ratio of 14.59, it trades below the wider S&P 500 average. Its Price/Earnings to Growth (PEG) ratio also implies the share is valued appealingly relative to its anticipated future profit growth, which experts project at almost 16% each year.
- Sufficient Financial Base: The firm has middle scores for Financial Health (5/10) and Profitability (6/10). Important good points involve a firm Current Ratio of 2.30, showing good immediate liquidity, and Return on Invested Capital (ROIC) that beats 85% of its capital markets industry competitors. While its borrowing amounts are somewhat high, they are workable within the setting of its cash generation and industry standards.
This fundamental view is vital for the plan because it spots LPLA as a firm that is effectively performing and enlarging its business, giving a firm reason for why the share could rise over the extended horizon. Firm growth is the main force of a "growth share" idea.
Technical Setup: A Pattern of Potential
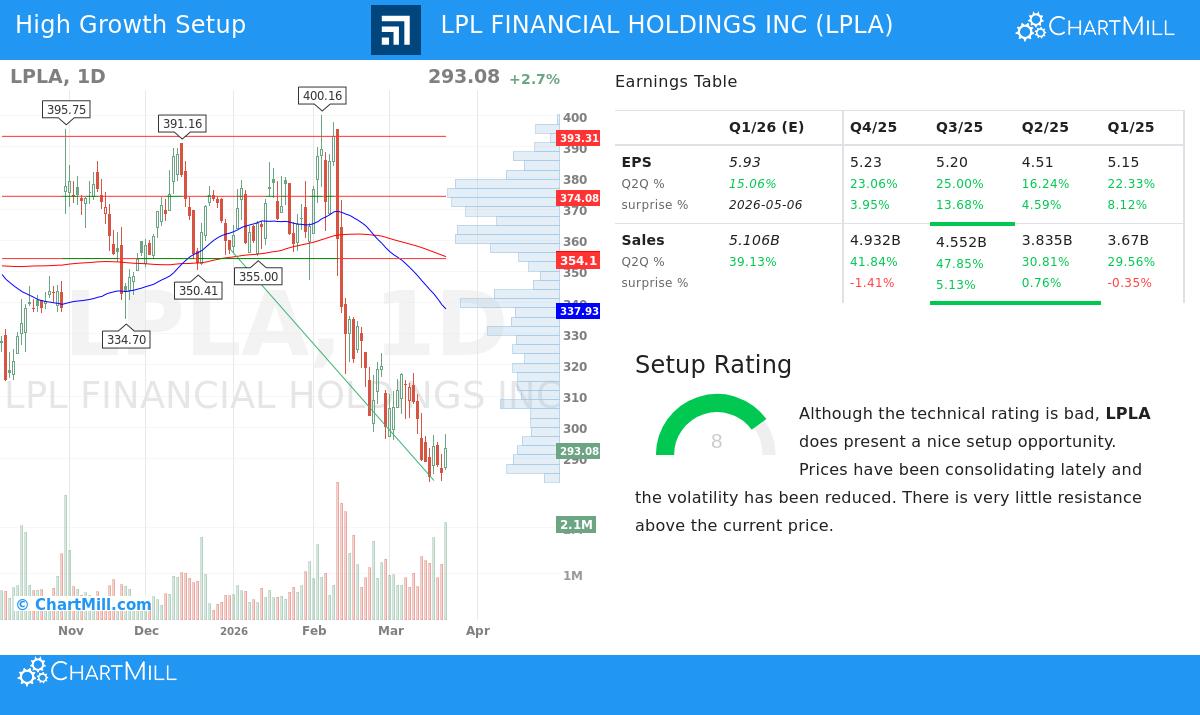
While fundamentals give the "why," technical study assists with the "when." LPLA’s present price chart formation shows an interesting setup, getting a high Setup Rating of 8 out of 10 in its ChartMill Technical Analysis Report. This rating emphasizes a possible chance coming from a time of poor performance.
The share has been in a clear downward direction, with both immediate and extended-horizon trends rated as bad. Still, inside this wider drop, the price activity has lately moved into a stage of lower instability and sideways movement. The report states the share is "now showing a bear flag pattern," which usually forms as a halt after a fast fall. While frequently a continuation pattern, the essential part stated by ChartMill is the simultaneous "lower instability while prices have been moving sideways" and the note that "there is minimal blocking above the present price."
This mix is central for a breakout plan. The sideways movement shows a fight between sellers losing their force and new buyers possibly entering. A clear move above the recent sideways range—especially a move above the closest seen block near $316.93—could cancel the bearish formation and mark a turn, starting a new wave of purchase interest. The low above blocking means that, if a breakout happens, the share could have space to advance before meeting notable selling pressure.
Conclusion: A Convergence of Signals
LPL Financial Holdings Inc shows a situation where notable fundamental growth meets a technical chart that is forming for a possible turning point. The firm’s firm revenue and profit enlargement give a solid base for extended-horizon investment, while the present technical formation suggests the share may be approaching the end of its corrective stage. For investors using a growth-with-breakout plan, LPLA represents a share to observe carefully for a confirmed technical sign that matches its firm business path.
This study was prompted by a filter made to find Strong Growth Stocks with good Technical Setup Ratings. You can examine more shares that fit similar mixed conditions by using the pre-configured stock screener.
Disclaimer: This article is for information only and does not form financial guidance, a suggestion, or a deal or request to purchase or sell any securities. The information shown is based on supplied data and should not be the only base for any investment choice. Investing carries risk, including the possible loss of original capital. Always do your own study and think about talking with a registered financial consultant before making any investment choices.