
In growth investing, joining a solid technical plan with firm fundamental momentum can be an effective way to find possible leading stocks. One technique that shows this is the method made known by trader Mark Minervini, which depends on his Trend Template. This template is a strict group of technical rules meant to select for stocks already in strong, confirmed uptrends, what Minervini terms "Stage 2" advances. The reasoning is simple: the largest gainers are frequently those that are already gaining, displaying firmness in both price and comparative performance. To this technical base, investors frequently add fundamental filters for "high growth momentum," looking for firms that are not only moving up on the chart but are also proving speeding up business results through measures like earnings beats, sales increases, and rising analyst estimates. This two-part method tries to find stocks where getting better fundamentals are being seen and valued by the market.
DORIAN LPG LTD (NYSE:LPG) offers a strong example for this joined method. The company providing liquefied petroleum gas (LPG) shipping services has shown a chart formation that fits neatly with the strict needs of a momentum-based plan.
A Classic Technical Trend
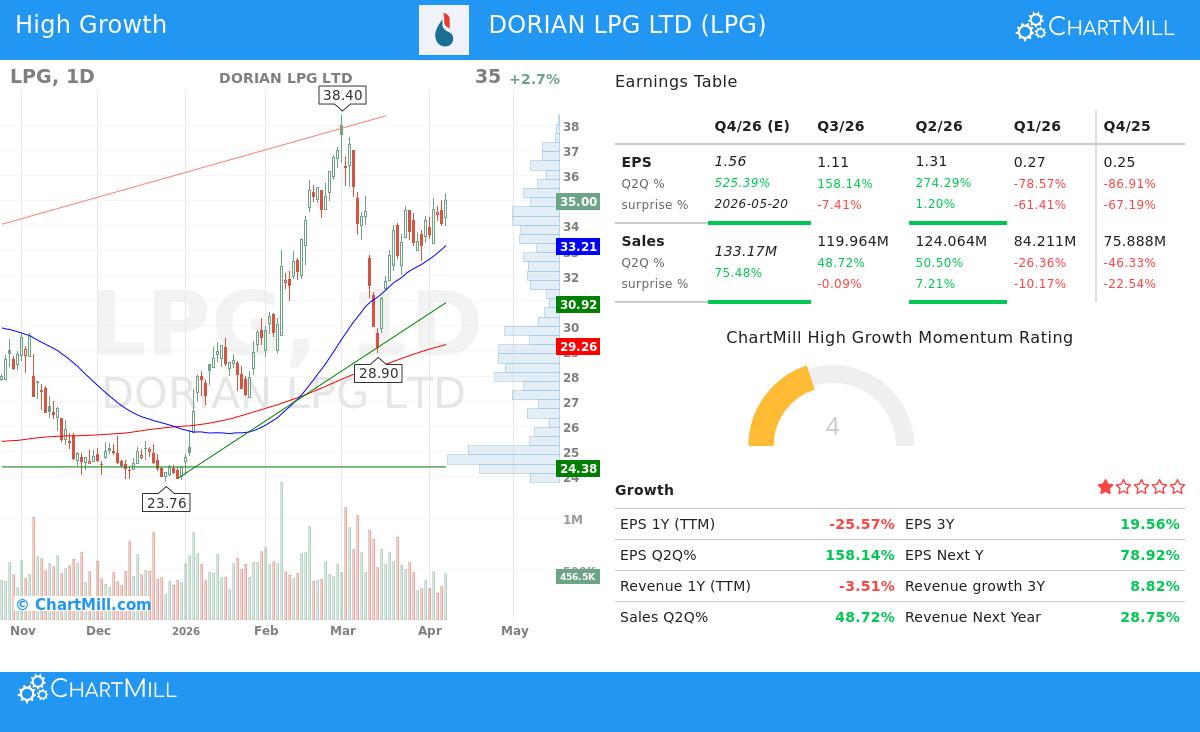
Looking at LPG's price movement shows it meets all the important points of the Minervini Trend Template, which is needed to verify a stock is in a sound, lasting uptrend instead of a short-lived rise.
- Moving Average Arrangement: The stock's present price rests well above its main moving averages, the 50-day ($33.21), 150-day ($29.41), and 200-day ($29.26). Also, these averages are in the correct bullish order: the nearer-term 50-day average is above the longer-term 150-day and 200-day averages, and the 150-day is above the 200-day. This ordered, climbing arrangement points to steady buying interest across many time periods.
- Nearness to Highs: LPG is changing hands within 10% of its 52-week high of $38.40, a main idea of the trend-following method. The plan purposely does not look at "low-priced" stocks staying near lows, concentrating instead on firmness. At the same time, the stock is almost 80% above its 52-week low, confirming a major and confirmed recovery trend exists.
- Better Comparative Strength: Maybe most importantly, LPG has a ChartMill Comparative Strength (CRS) score of about 90. This means it has done better than almost 90% of all stocks in the market over the last year. In Minervini's system, leading comparative strength is essential; it shows the stock is a market leader, not just a passive part of a rising market.
This technical view is exactly what the Trend Template is made to find: a stock in a clear, long-term uptrend with top comparative performance, hinting at institutional buying and a greater chance of the trend continuing.
Fundamentals Backing the Momentum
While the chart shows the "what," the fundamental numbers give reason for the "why." For a high-growth momentum investor, LPG's latest business results give strong reasons that may explain its technical firmness.
- Very High Quarterly Earnings Increase: The latest quarter shows a huge year-over-year EPS increase of over 158%. Even more notable, the quarter before saw growth of 274%. This speeding up in earnings is a standard sign of firms starting a high-momentum stage and is a main filter in growth screens.
- Firm Analyst Belief: The market's forward-looking view seems positive. Analyst guesses for the firm's next-year earnings have been moved up by over 10% in the last three months. Such upward changes often come before more price gains as the better outlook becomes part of the price.
- Solid Profit Margins: The firm has shown it can turn revenue into profit well. Its profit margin in the last reported quarter was a sound 39.3%, and it has kept firm margins in recent times, showing price strength and operational command in its specialty area.
- Positive Sales Comeback: After a time of shrinking, revenue growth has turned sharply positive, with the last quarter showing a nearly 49% rise year-over-year. Guesses for the next quarter point to growth above 75%, drawing a picture of a firm demand recovery.
These fundamental measures, especially the speeding up in earnings and sales, are just what high-growth momentum plans look for. They hint the firm is in a good cyclical or competitive spot, giving a fundamental reason that backs the strong price trend.
Technical Condition and Setup Value
Beyond the basic trend filters, a closer technical study using ChartMill's own scores further confirms LPG's position. The stock gets a perfect Technical Score of 10/10, showing very good health across short and long-term periods. The report states both trends are positive and that LPG shows "a good and steady pattern of rising prices."
Also, the study finds a good risk/reward setup forming. With a Setup Quality score of 7, the stock is seen as settling in a fairly narrow band near its highs after a firm run. The report points out a clear support area around $33.21 and states "very little resistance above the present price." This kind of settling, often called a "volatility squeeze," inside a continuing uptrend can come before the next move up. For a full look at the support, resistance, and a sample trade setup, you can see the complete Technical Analysis Report for LPG.
Conclusion
DORIAN LPG LTD shows the kind of candidate that comes from a joined technical and fundamental momentum filter. Its chart formation closely follows the rules of the Minervini Trend Template, confirming a firm, leader-level uptrend. At the same time, its basic business is showing signs of strong speeding up in earnings and sales, with analysts becoming more positive, main parts for high-growth investors. While past results are never a promise, this matching of a technically sound chart with getting better fundamental momentum makes LPG a stock worth more study for investors using such plans.
Interested in finding similar possible chances? You can use the same "High Growth Momentum + Trend Template" filter that found LPG to see other stocks now meeting these strict rules. Click here to view the filter and its present results.
,
Disclaimer: This article is for informational and educational purposes only. It is not intended as investment advice, a recommendation, or an offer to buy or sell any security. The analysis is based on data provided and certain methodologies, but past performance does not guarantee future results. Always conduct your own due diligence, consider your financial situation and risk tolerance, and consult with a qualified financial advisor before making any investment decisions.