
In the search for high-potential stocks, a method that examines both technical momentum and fundamental growth can be especially effective. One such technique is to combine Mark Minervini's strict Trend Template, a group of technical rules made to identify stocks in clear, strong uptrends, with a filter for high-growth momentum. This two-step method aims to find companies that are both showing solid price movement and institutional interest and have the support of improving business fundamentals. The objective is to find securities where technical condition and fundamental progress meet, possibly creating conditions for notable price gains.
LIBERTY LIVE HOLDINGS-C (NASDAQ:LLYVK), a tracking stock for Liberty Media's stakes in live events and entertainment, recently appeared from this kind of screening process. We will look at how it measures up to the joined standards of technical trend following and high-growth traits.
Matching the Minervini Trend Template
Mark Minervini's strategy is based on trading in the direction of the most solid trends. His Trend Template gives a fixed, required checklist to confirm a stock is in a sound Stage 2 advance before review. For LLYVK, the technical match is evident:
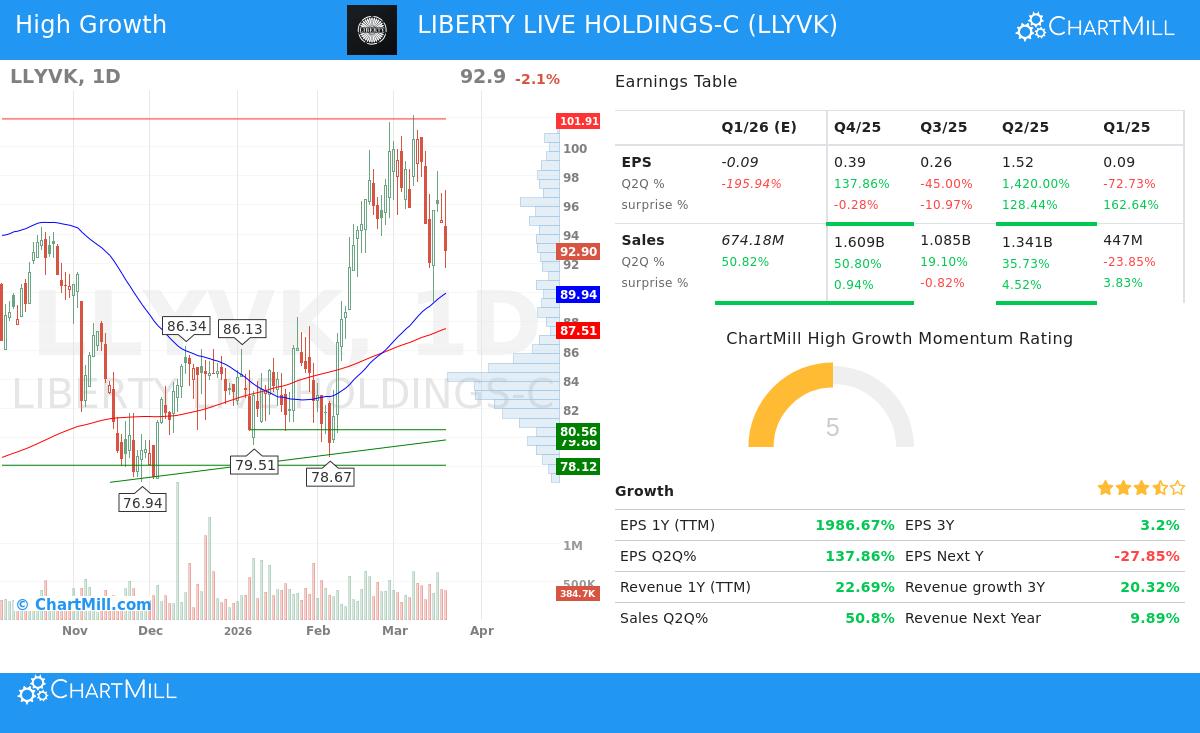
- Price Above Key Moving Averages: The stock's last price of $92.9 trades above its rising 50-day ($89.94), 150-day ($89.62), and 200-day ($87.51) simple moving averages. This order confirms the stock is in a clear uptrend across several timeframes.
- Moving Average Order: The 50-day SMA is above both the 150-day and 200-day SMAs, and the 150-day SMA is above the 200-day SMA. This positive sequence points to continued and building momentum, a key feature of Minervini's preferred setups.
- Nearness to Highs: With a 52-week high of $102.62, LLYVK's current price is within 10% of its yearly peak. Minervini notes that real market leaders often trade close to their highs, not staying far below them. At the same time, the stock is more than 50% above its 52-week low of $60.55, showing a solid recovery trend.
- Strong Relative Strength: A ChartMill Relative Strength (CRS) score of 85.39 shows LLYVK is performing better than about 85% of all stocks over the last year. High relative strength is a key part of the strategy, as it indicates the stock is a leader, drawing institutional money even in an uncertain market.
This technical view meets the main Trend Template, indicating LLYVK is in a positive uptrend with good underlying support. The recent short-term trend has become neutral as the stock moves back from its highs, which, in the Minervini approach, can offer a possible entry point if the stock creates a tight consolidation shape like a Volatility Contraction Pattern (VCP).
Meeting the High-Growth Criteria
While the Trend Template confirms technical condition, the "High Growth Momentum" filter looks for signs of fundamental improvement. This is important because, as Minervini states, the largest stock market winners are nearly always backed by strong earnings and sales growth. LLYVK displays several notable growth measures:
- Very High Earnings Growth: The most notable number is the trailing twelve-month (TTM) EPS growth of 1,987%. This very large year-over-year rise, while possibly affected by a low starting period, shows a major shift to profitability. Quarterly data shows changes but includes strong jumps, such as 1,420% growth two quarters ago and 138% growth in the latest quarter.
- Solid Revenue Growth: Top-line growth is healthy, with TTM revenue up 22.7%. The latest quarter saw sales increase 50.8% year-over-year, showing current business activity stays solid.
- Positive Estimate Changes (with a note): While the average estimate for next year's EPS has had a small decrease over the past three months, revenue estimates for the next year have stayed almost flat, falling only 0.06%. The company has a record of exceeding expectations, beating revenue estimates in three of the last four quarters.
- Better Profitability: The annual profit margin is at a good 12.4%, a marked gain. While quarterly margins have varied, the overall direction from the previous year shows a company achieving better operational efficiency.
These fundamentals fit with the growth-focused part of the screen. The method suggests that such strong fundamental gains can work as a driver, pulling analyst focus and institutional investment, which then supports further price momentum.
Technical Pattern and Risk Points
According to the detailed ChartMill Technical Report, LLYVK has a solid technical rating of 8 and an equally good setup rating of 8. The report states that prices have been consolidating lately, with lower volatility. A decline is happening, which might be forming a positive pattern. A main resistance area is found between $100.44 and $101.91. A clear move above this area on high volume could indicate the next upward move.
The report also points out important support levels, mainly an area between $78.12 and $80.56, which would act as a reasonable place for a stop-loss order if the current consolidation does not hold. The existence of a recent "Pocket Pivot" signal, a price increase on volume greater than any down volume day in the previous ten sessions, is mentioned as an extra good sign of institutional buying.
For a complete view of the support, resistance, and automated trade pattern, you can see the full technical analysis here: LLYVK Technical Analysis Report.
A Subject for More Review
LIBERTY LIVE HOLDINGS-C (LLYVK) shows a situation where a strict screening process has found a security that satisfies exact dual standards. Technically, it fits with the strict trend-following ideas of the Minervini method, trading in a confirmed uptrend with strong relative strength. Fundamentally, it displays the type of very high earnings and sales growth that high-momentum investors look for as a driver for ongoing price gains.
It is necessary to recall that screening is the initial phase, not the final one. Any possible investment needs more thorough investigation, including review of the wider market condition, where the S&P 500's long-term trend is now down, sector factors, and a detailed look at the company's specific business drivers and future prospects.
Want to look at other stocks that pass this combined "High Growth Momentum + Trend Template" screen? You can find the present list and use the screen yourself with this link: High Growth Momentum + Trend Template Screen.
Disclaimer: This article is for informational and educational purposes only. It is not intended as investment advice, a recommendation, or an offer to buy or sell any security. The analysis is based on data provided and screening methodologies described, which have inherent limitations. You should conduct your own research and consult with a qualified financial advisor before making any investment decisions. Past performance is not indicative of future results. Investing involves risk, including the potential loss of principal.