
LIFE360 INC (NASDAQ:LIF) has been identified as a high-growth momentum stock that aligns with Mark Minervini’s Trend Template. The company, known for its family safety and location-sharing mobile applications, demonstrates strong technical and fundamental characteristics, making it a candidate for growth-focused investors.
Why LIF Fits the Minervini Trend Template
Minervini’s strategy focuses on stocks exhibiting strong uptrends with clear technical strength. LIF meets these criteria:
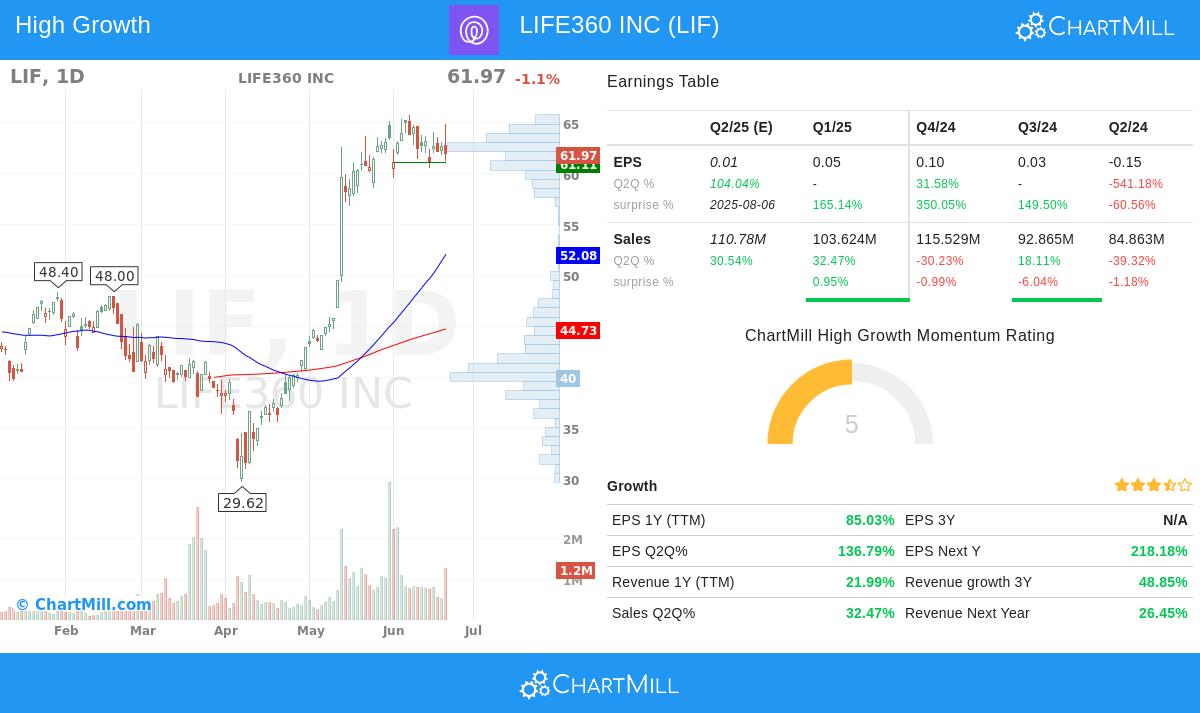
- Price Above Key Moving Averages: The stock is trading above its 50-day ($52.08), 150-day ($46.08), and 200-day ($44.73) moving averages, confirming a bullish trend.
- Rising Moving Averages: Both the 150-day and 200-day MAs are trending upward, reinforcing long-term strength.
- Relative Strength: With a ChartMill Relative Strength score of 96.9, LIF outperforms nearly 97% of all stocks, indicating strong momentum.
- Price Near 52-Week High: At $61.97, LIF is within 6% of its 52-week high ($65.79), a sign of sustained upward momentum.
High Growth Fundamentals
Beyond technical strength, LIF shows robust growth metrics:
- Earnings Growth: EPS growth (TTM) stands at 85%, with recent quarterly EPS growth at 136.8%. The company has beaten EPS estimates in three of the last four quarters, with an average beat of 151%.
- Revenue Growth: Revenue growth (TTM) is 21.99%, with recent quarterly sales growth at 32.47%. Analysts have revised next-year EPS estimates upward by 8.33% in the last three months.
- Profitability Improvement: The profit margin in the latest quarter was 4.22%, up from negative figures in prior years, indicating improving operational efficiency.
- Free Cash Flow Growth: FCF per share surged by 418% year-over-year, reflecting strong cash generation.
Technical Outlook
The ChartMill Technical Report assigns LIF a perfect technical rating of 10, highlighting its strong uptrend and consolidation pattern. Key takeaways:
- The stock is in a bullish flag formation, suggesting potential continuation.
- Support is found near $61.08, providing a clear stop-loss level.
- Resistance sits at $65.04, with a breakout potentially signaling further upside.
Our High Growth Momentum + Trend Template screener lists more stocks meeting these criteria.
Disclaimer
This is not investment advice. Always conduct your own research and consider risk management before making investment decisions.