
For investors who use chart patterns to inform their choices, the search for good prospects often centers on two main parts: a stock's basic technical condition and a defined, lower-risk moment to begin a position. A structured way to do this is the Technical Breakout Setup, which finds stocks showing both a good upward trend and a period of sideways movement that hints a possible rise is near. This process uses specific scores from ChartMill: the Technical Rating, which judges the general condition and direction of a stock, and the Setup Quality Rating, which examines the concentration of recent price movement to find better entry areas.
Kroger Co. (NYSE:KR), the national supermarket chain, now shows a pattern that fits this breakout method. The stock's technical measures and recent price activity suggest it could be ready for its next upward move, giving a planned situation for traders who watch price momentum.
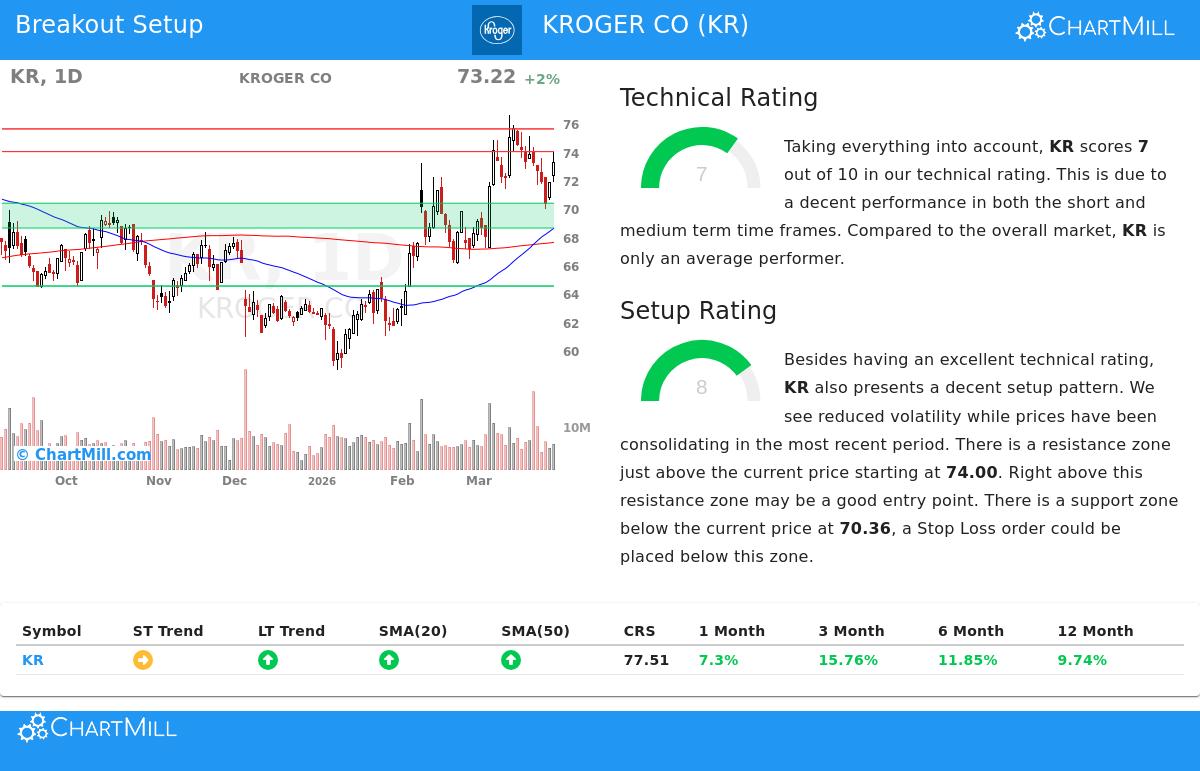
Looking at the Technical Base
The essential part of any breakout idea is a stock already in a verified upward trend, as this raises the chance that a move out of sideways trading will keep going in the current direction. Kroger's ChartMill Technical Report gives it a good Technical Rating of 7 out of 10. This number shows a sound technical situation made from several points:
- Good Long-Term Direction: The study confirms the stock's long-term direction is good. This is a vital filter for breakout methods, as it means the stock is already in a set upward trend and any breakout is more probable to be a continuation instead of a turn.
- Good Moving Average Arrangement: The stock is priced above all its main simple moving averages (20, 50, 100, and 200-day), and each of these averages is itself in a rising pattern. This layered arrangement of support points is a standard sign of a sound upward trend.
- Sturdy Behavior: While the wider S&P 500 has been in a negative trend, Kroger has shown comparative firmness. It is trading in the higher part of its 52-week range and has done better than about 77% of all stocks over the last year, indicating its sturdiness.
This mix of a good long-term direction, good moving average support, and market-outperforming behavior supplies the needed "technical condition" that breakout traders look for. It implies the stock has basic momentum that could support a rise if a clear entry trigger appears.
Judging the Setup Condition
A firm trend by itself is not a sign to purchase, entering after a fast increase holds notable risk of a decline. This is where the Setup Quality Rating becomes important. It finds times of sideways or "close" price activity inside the upward trend, which often come before the next breakout. Kroger gets a high Setup Rating of 8, meaning a very good period of sideways movement.
The technical report lists the traits that lead to this high number:
- Recent Sideways Movement: Over the last month, Kroger has traded in a band between about $67 and $76. It is now moving sideways in the middle of this band, which the report states "may give a good entry chance."
- Set Support and Resistance: The setup is bounded by clear technical points. There is a support area found between $68.61 and $70.36, made by a combination of moving averages and trend lines. Just above the present price, a resistance point is at $74.00 from a flat line on the daily chart.
- Lowered Variation: The report specifically notes "lowered variation while prices have been moving sideways," which is a main part for a high-condition setup. Tighter trading bands often signal a gathering of force that can be let out in a clear directional move.
For a breakout method, this setup is exactly what investors search for. The high rating confirms the stock is not stretched too far but is instead tightening inside a well-marked band, with clear points to handle risk (support) and recognize confirmation of a move (resistance).
A Planned Trade Situation
Built on this study of technical condition and setup quality, the ChartMill report proposes a specific, rule-based trading possibility. The suggested setup uses the set resistance point as a trigger:
- Entry: A buy stop order at $74.01, set just above the $74.00 resistance area. This makes sure the trade is only started if the stock gains enough momentum to pass through this important point.
- Exit (Stop Loss): A stop loss order at $69.95, set just below the found support area near $70.36. This sets the greatest risk on the trade.
- Risk Handling: This plan limits the worst loss to about 5.5% on the trade itself. The report also figures that using 18.2% of a portfolio for this position would lead to a total portfolio risk of 1.0%, showing how position size works with the technical setup.
It is very important to note that this is an example made from the technical factors. The given points should work as a beginning for your own study. Always think about near company events, like earnings reports, and change stop losses and position sizes to match your own risk comfort and trading plan.
Kroger Co. shows the kind of chance technical breakout searches are made to find: a basically sound stock inside a firm trend, taking a break that creates the conditions for a possible next rise. For investors wanting to look at other stocks now showing similar mixes of technical condition and high-condition setups, new results from the Technical Breakout screen can be seen each day through this link.
Disclaimer: This article is for information only and is not investment advice, a suggestion, or an offer or request to buy or sell any securities. The study shown is based on technical measures and automated reports, which are not promises of future results. All investing and trading includes risk, including the possible loss of your original investment. You should do your own research and talk with a qualified financial advisor before making any investment choices.