
For investors using a technical breakout method, the aim is to find stocks that are in a firm, clear uptrend and are also moving in a narrow band, preparing for a possible next rise. This method uses two main proprietary measures from ChartMill: the Technical Rating, which judges the general condition and direction of a stock, and the Setup Quality Rating, which judges the condition of the present tight pattern to find the best entry points. A stock with high marks on both measures shows a notable chance, as it indicates a technically good asset is tightening for a possible breakout.
Kinetik Holdings Inc (NYSE:KNTK), a midstream energy services company working in the Permian Basin, is now on such a breakout scan. With a Technical Rating of 7 and a very good Setup Quality Rating of 9, KNTK shows a profile that technical traders frequently look for.
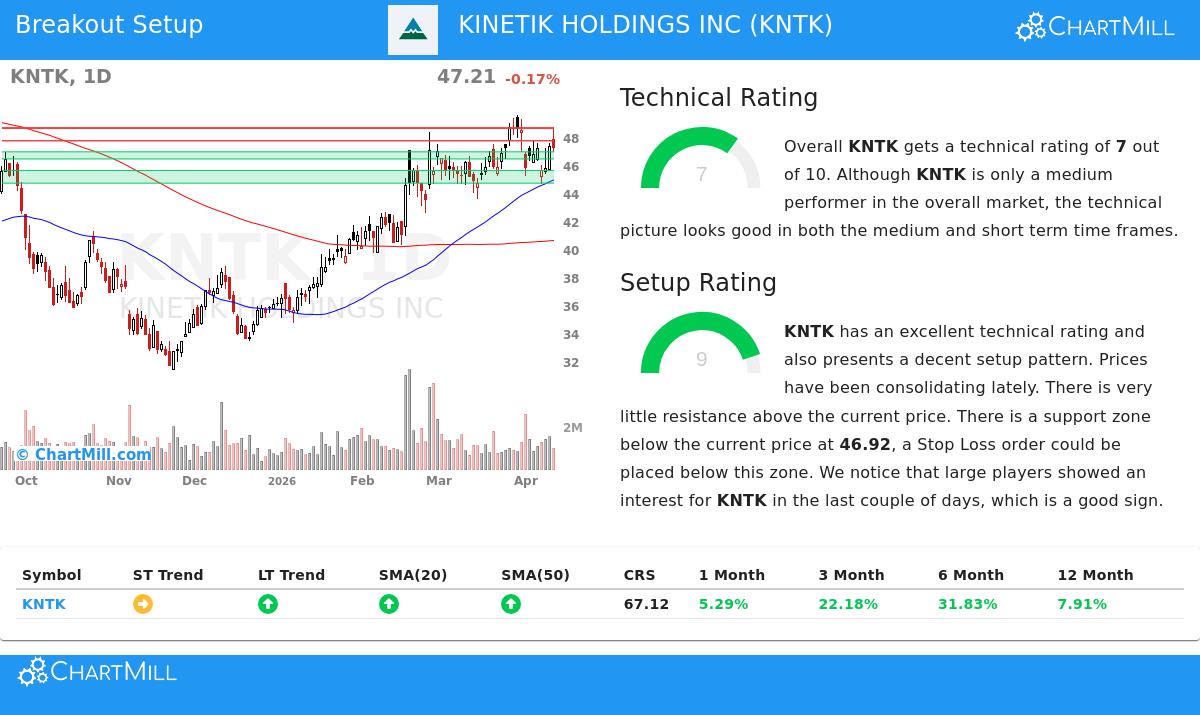
Technical Strength: A Firm Base
The ChartMill Technical Rating of 7 shows KNTK is in a clear uptrend. This score is key for the breakout method because it selects for stocks with existing momentum, raising the chance that a breakout will continue instead of ending quickly. The detailed technical report notes several good parts adding to this rating:
- Trend Agreement: The long-term trend is good, while the short-term trend is neutral. This mix is often viewed as sound, suggesting the stock is pausing inside a larger upward move.
- Place vs. Market: KNTK is trading close to its 52-week high, a mark of strength. Its results over the last year match the wider S&P 500, which is also in a good long-term trend, giving a helpful market setting.
- Moving Average Backing: The stock is trading above all its main simple moving averages (20, 50, 100, and 200-day), and each of these averages is going up. This ordered line is a standard mark of wide buying force across many time frames.
While the report says that KNTK's industry-relative results could be better, its direct price movement and trend form give a firm technical base, which is the first and most important filter for a breakout candidate.
Setup Quality: The Tightening Before the Move
A strong trend by itself is not a buy signal; entering at a high point has risk. This is where the very good Setup Quality Rating of 9 becomes key. This score finds tight patterns, answering the "when to buy" question by pointing out times where movement lessens and a clear support level is formed.
The study for KNTK shows a standard setup:
- Price Tightening: The report says that "prices have been tightening recently," which is the center of a good setup. Over the last month, KNTK has traded in a band between $43.54 and $49.55 and is now near the top of that band.
- Clear Support and Resistance: The technical study finds two clear support zones below the present price (around $46.92 and $44.68-$45.59) and specific resistance levels above (mainly at $47.71 and $48.59-$48.65). This makes a well-marked trading band.
- Large Trader Interest: An extra good point is that big players have shown interest in KNTK in recent days, as measured by the Effective Volume tool. Buying during a tight phase can come before a breakout.
For a trader, this setup means a clear, rule-based plan: a breakout above the near resistance (suggested entry at $47.72) could mark the start of the next upward move, with a stop-loss set just below the close support zone (suggested exit at $46.40) to control risk.
Conclusion and Next Actions
Kinetik Holdings Inc (KNTK) shows the kind of chance technical breakout screens are made to find. It has the two marks of a medium-term uptrend (Technical Rating 7) and a high-condition, low-movement tight pattern (Setup Rating 9). This mix suggests the stock has formed a base of support and is getting ready for a possible try to test higher prices.
It is key to recall that no screen or rating assures a win. The automatically made trade details should be checked and changed based on a person's risk comfort, and investors should always know of coming company events, like earnings reports, that could change price movement.
For investors trying to find similar technical setups each day, you can run the live Technical Breakout Setups screen here.
Disclaimer: This article is for information only and is not investment advice, a suggestion, or an offer or request to buy or sell any securities. The study is based on technical measures and past data, which are not promises of future results. You should do your own study and talk with a qualified financial advisor before making any investment choices.