
For investors who use charts and price action to guide their decisions, finding good opportunities often involves two key questions: which stocks are in a good upward pattern, and when is the best time to enter a position? A methodical way to do this is to look for stocks that mix a solid existing upward pattern with a current time of price stability, indicating a possible breakout is near. This process selects securities that are not only going the right way but are also taking a break to gather force for their next upward move, providing a more distinct entry point with clear risk.
KINETIK HOLDINGS INC (NYSE:KNTK), a midstream energy services company operating in the Permian Basin, recently appeared from this kind of technical search process. The stock shows a profile that fits the standards looked for by breakout-oriented technical investors, mixing good trend condition with a high-standard setup pattern.
Technical Condition: A Good Base
The first part of a possible breakout choice is a solid and confirmed upward pattern. This shows continued buying interest and market strength, which raises the chance that a breakout from stability will keep going in the current direction. Kinetik's technical profile, as explained in its ChartMill Technical Analysis report, shows this basic condition.
- Pattern Agreement: Both the near-term and longer-term patterns for KNTK are scored as positive. This agreement across different time periods is a strong sign, suggesting force is not a short-term occurrence but part of a wider, continued move.
- Moving Average Backing: The stock is priced above all its main simple moving averages (20, 50, 100, and 200-day), and each of these averages is itself in a rising arrangement. This layered agreement of support levels is a standard feature of a good upward pattern.
- Relative Results: While the wider S&P 500 shows a negative longer-term pattern, Kinetik has done much better than the market over the last three months, displaying clear relative condition inside its sector.
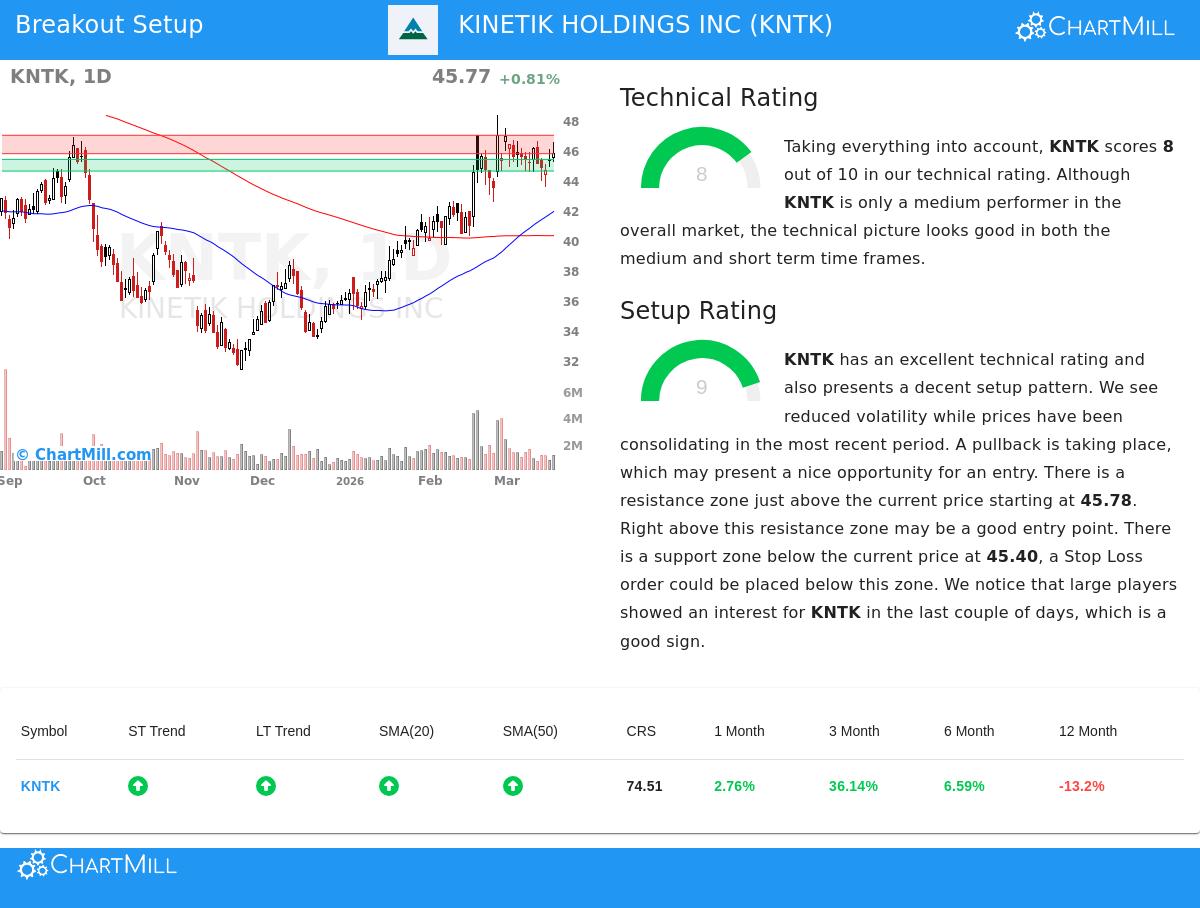
This mix leads to a ChartMill Technical Rating of 8 out of 10, labeling KNTK as a stock in a verified upward pattern. For a breakout plan, this solid technical rating is important, it means any possible breakout is more probable to happen inside the setting of an existing positive trend, instead of being an opposite-pattern move likely to not succeed.
Setup Standard: The Stability Before the Advance
A solid pattern by itself is not a signal to buy; entering during a steep climb often results in buying at a high. The second, just as important question is timing. This is where the standard of the current price setup matters. A quality setup shows a time of stability or base-forming, where price movement narrows and the stock trades in a fairly tight band, forming clear support. Kinetik currently displays these features, getting a high ChartMill Setup Quality Rating of 9.
- Specific Trading Band: Over the last month, KNTK has been stabilizing inside a band between about $42.57 and $48.37. It is now trading in the center of this band, showing a halt in the earlier trend.
- Clear Support and Resistance: The technical analysis finds a specific support area between $44.62 and $45.40, made by a combination of trendlines and moving averages. On the other side, a resistance area is between $45.78 and $47.01. This makes a well-outlined price structure for traders to work with.
- Lowered Movement & Large Investor Activity: The report mentions lowered movement during this stability phase, a common sign before a notable price change. Also, there are signs of buying by large investors in recent trading periods, often a positive signal that experienced money is preparing for the next rise.
This high setup rating is what changes Kinetik from a simply strong stock into a possible breakout choice. The stability allows for finding a reasonable entry point (a move above resistance) and a close, logical stop-loss level (a move below support), which are necessary for controlling risk.
A Possible Trade Plan
Based on this technical structure, the analysis proposes a specific plan for breakout traders. An entry could be thought about on a move above the found resistance area, specifically above $47.02. This would signal that the stability time has finished and the earlier upward pattern is starting again. To control risk, a stop-loss order could be set just below the main support area at $44.61. This plan would cap the calculated loss on the trade to about 5.1%, giving a good risk/reward setup if the breakout happens as expected.
It is important to state that this is an example made from the technical patterns. Traders should always change such details to match their own risk comfort and verify the setup by looking for near-term events like earnings reports.
Locating Comparable Prospects
Kinetik Holdings shows the kind of opportunity that methodical technical searching tries to find. For investors wanting to see a new list of stocks that meet similar standards of solid patterns and high-standard setups, the daily Technical Breakout Setups search is a useful tool. You can find more possible breakout choices by going to the Technical Breakout Setups screen on ChartMill.
Disclaimer: This article is for information only and does not make up investment guidance, a suggestion, or an offer to buy or sell any security. The analysis is based on technical data and patterns, which are not certain. All investing and trading includes risk, including the possible loss of principal. Always do your own research and think about talking with a registered financial advisor before making any investment choices.