
For investors aiming to benefit from the active potential of growth stocks, a disciplined method that combines basic strength with chart timing can be an effective instrument. One such tactic involves filtering for companies showing solid basic business growth, marked by powerful sales and earnings increases, firm profitability, and a sound financial position, while also showing encouraging chart formations that indicate a possible price rise. This technique seeks to find stocks where attractive business basics are gaining market notice, possibly marking the beginning of a continued upward trend. A recent filter using this dual review has pointed to Kiniksa Pharmaceuticals International Plc (NASDAQ:KNSA) as a candidate for more detailed review.
A Basic Profile of Strength and Growth
The foundation of this investment method is finding companies with firm and maintainable growth paths. Kiniksa’s basic report, available in detail here, shows a profile that fits these standards well. The company receives a solid overall Growth Rating of 8 out of 10, supported by very strong recent results and encouraging future projections.
- Very Strong Past Growth: The company has shown notable operational speed. Over the last year, Revenue jumped by 55.68%, while Earnings Per Share (EPS) rose by an exceptional 421.43%. This shows not only revenue increase but also major steps toward net profitability.
- Firm Future Projections: Analysts expect this speed to persist, with estimated yearly EPS growth of 47.22% and Revenue growth of 24.42% in the next years. For a growth investor, this forward expectation is a vital part, as future possibility is a main factor in valuation.
- Profitability and Financial Soundness: Backing this growth story are firm ratings for Profitability (6) and Financial Soundness (7). Kiniksa displays sector-leading margins, including a Gross Margin of 87.52% and a Profit Margin of 6.01%, which do better than most of its biotechnology competitors. Financially, the company has no debt and keeps firm liquidity, with a Current Ratio of 3.85. This mix of high growth, firm margins, and a clear balance sheet offers a basic buffer often wanted in growth-focused biopharmaceutical investments.
Chart Formation Indicates a Possible Price Rise
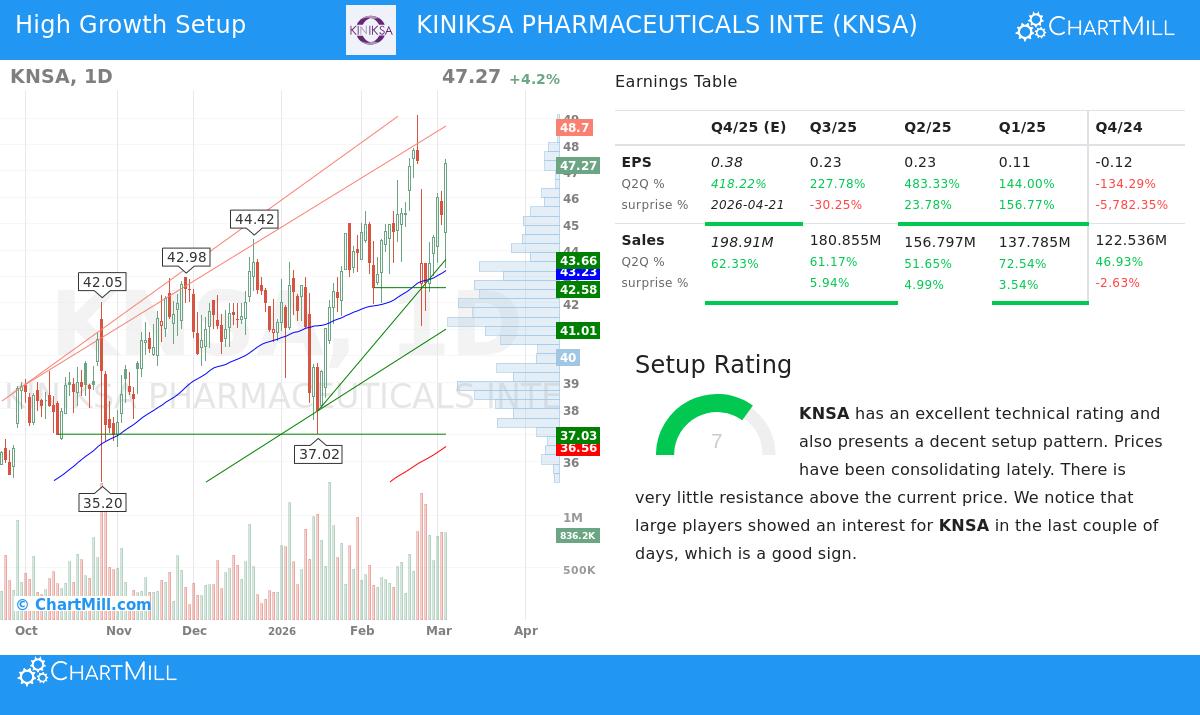
While firm basics give the "why" for an investment, chart study can help find the "when" by measuring market feeling and price movement. Kiniksa’s chart study report, viewable here, presents an attractive picture, receiving a complete overall rating of 10 and a Setup Rating of 7.
- Established Long-Term Trend: The stock is in a clear and set long-term upward trend, trading well above its important moving averages (50-day, 100-day, and 200-day). This steady result is seen in its 12-month return of almost 120%, which does better than 94% of all stocks in the market.
- Tight Trading Near Highs: Lately, the stock has started a phase of tight trading, moving within a band between about $41 and $49 over the last month. This kind of price activity, after a firm climb, can show a time of pause and gathering before the next possible step upward.
- Minimal Price Barriers Above: A main part of the positive formation is the observed absence of major price barriers above the present trading price. The study indicates that a clear move above the recent band high near $49.12 could start a price rise, with very little immediate chart-based selling to block more advancement.
Why the Mix is Attractive
The link between Kiniksa’s basic and chart reports is what makes it a notable example for this tactic. The basic study confirms the company is not just a speculative idea; it is a commercial-stage biopharma achieving growth and constructing a profitable business with a clear financial record. This speaks to the central risk of investing in price rise formations that lack foundation, without firm basics, a chart-based price rise can often be brief or incorrect.
In turn, the chart study shows that this basic strength is being recognized and responded to by the market. The established long-term upward trend shows continued buying interest, while the present tight trading near 52-week highs suggests the stock is preparing for its next step. The tactic proposes that when a basically firm growth stock starts to rise out of a positive chart formation, it may present a good balance of risk and potential gain for investors aiming to take part in its ongoing growth story.
Finding Related Possibilities
Kiniksa Pharmaceuticals shows one result of a structured search for stocks where firm growth basics meet positive chart formations. For investors curious about using this process to find other possible chances, the preset filter "Strong Growth Stocks with good Technical Setup Ratings" can be a useful beginning point for more study.
Disclaimer: This article is for information only and does not form investment guidance, a suggestion, or an offer to buy or sell any security. The study is based on data and reports from ChartMill, and past results are not a guide to future results. Investors should do their own review and think about their financial position, risk comfort, and investment goals before making any investment choices.