
For investors who use charts and price action to guide their choices, a methodical way to find possible opportunities is important. One method looks for stocks that are both technically sound and creating a particular price pattern. This plan centers on finding equities with a solid core trend that are also moving sideways, indicating they could be getting ready for their next notable move. The aim is to find stocks where a move upward from this sideways phase might indicate a resumption of the existing uptrend.
KEYCORP (NYSE:KEY), the Cleveland-based banking holding company, recently appeared from such a technical filter. It offers a noteworthy example, as its present chart shows the two traits that technical traders frequently look for: a high technical health score and a good setup pattern.
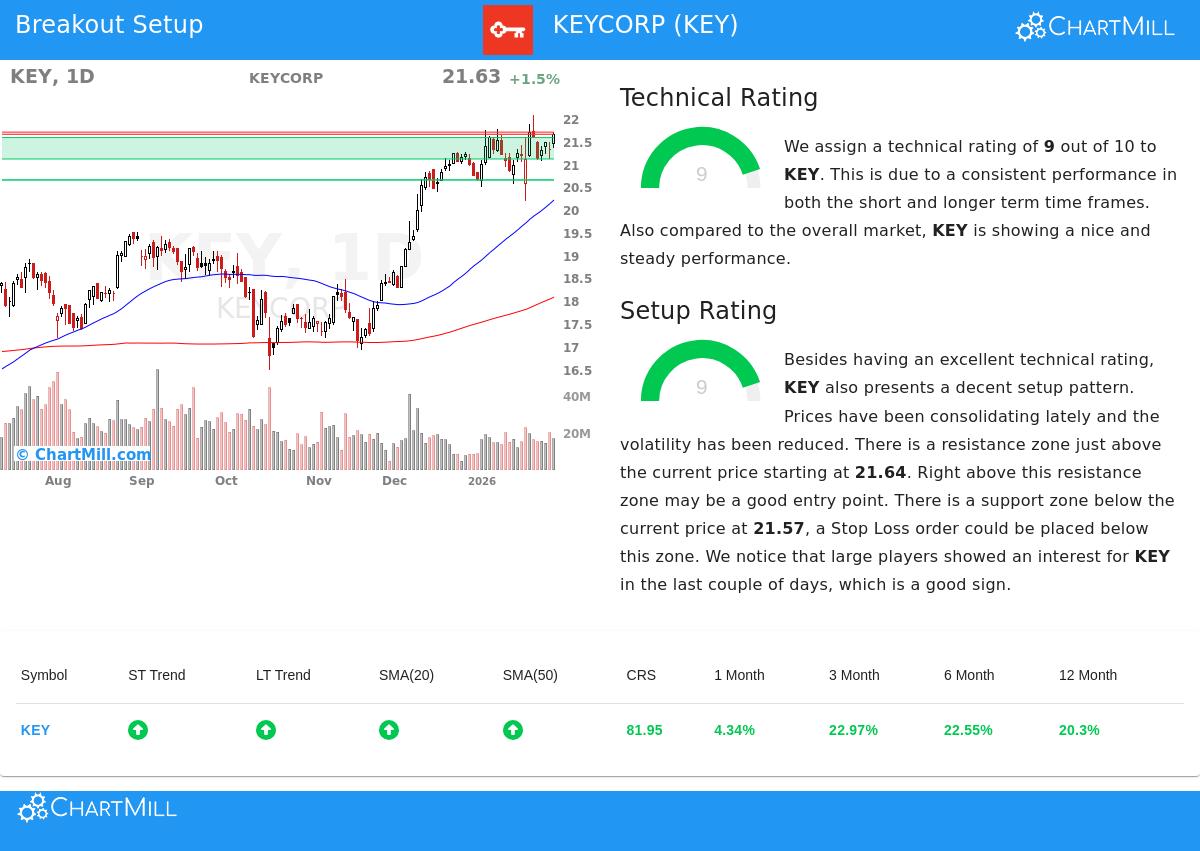
A Base of Technical Soundness
The first part of this plan is finding stocks with a sound and favorable trend. This is important because it raises the chance that any move upward will happen in the direction of the existing momentum. KEY’s technical picture, as described in its ChartMill Technical Analysis report, is very firm, receiving a leading rating of 9 out of 10.
This high rating comes from a number of specific factors:
- Favorable Trends on All Charts: Both the long-term and short-term trends for KEY are rated as favorable. This agreement shows continued buying interest and an absence of opposing signs between weekly and daily charts.
- Sound Performance Compared to Others: The stock is doing better than 77% of similar companies in the Banks industry and has performed better than 81% of all stocks over the last year. This comparative performance is a sign of market strength.
- Price Higher Than Important Averages: KEY is priced above all its main simple moving averages (20, 50, 100, and 200-day), and each of these averages is also in a rising pattern. This layered agreement of support levels is a typical indicator of a sound uptrend.
- Trading Close to Highs: The stock is now near its 52-week high, which frequently draws price and can show basic confidence from investors.
The Pattern: Sideways Movement Before a Possible Move Upward
A sound trend by itself is not a signal to buy; getting in at a high price can result in quick declines. This is where the second condition is important: the grade of the pattern. A good pattern searches for a sideways phase or "base" inside the uptrend, which gives a more distinct entry point and a sensible place to set a protective stop-loss order. KEY is also strong here, having a Setup Quality Rating of 9.
The technical report points out the features that make this a good pattern:
- Lowered Swings and Sideways Movement: Prices have been moving sideways lately inside a band, and price swings have lessened. This tightening action often comes before a clear move.
- Clear Resistance and Support: The analysis finds a definite resistance area just above the present price, starting near $21.64. A clear move above this area might be seen as the move upward. On the other hand, a firm support area exists below near $21.57, giving a possible place for a stop-loss order.
- Interest from Large Investors: The report mentions that big participants have shown interest in KEY in recent days, as seen in volume study. This can be a confirming sign that the stock is being watched by larger market players.
A Possible Trading Plan
From this study, a standard technical situation appears. The sideways movement has formed a resistance point. A move above this point, possibly started with a buy-stop order near $21.70, might be viewed as an entry sign for a resumption of the uptrend. The nearby support area then gives a sensible place to control risk, with a stop-loss order just below it, capping the possible loss on the trade to a set amount.
Find Other Possible Move Upward Patterns The process that found KEY is used each day to the wider market. Investors searching for comparable technical chances can find a current list by going to the Technical Breakout Setups screen.
Disclaimer: This article is for information only and is not investment advice, a suggestion, or an offer or request to buy or sell any securities. The study is based on technical information and patterns, which are not certain to forecast future price changes. All trading and investment choices include risk, including the possible loss of principal. Readers should do their own study and talk with a qualified financial advisor before making any investment choices.