
Investors looking to join strict technical rules with basic growth study often use methods like the one made common by Mark Minervini. His plan, called Specific Entry Point Analysis (SEPA), uses a step-by-step process to find stocks showing firm price direction, better comparison to the market, and faster basic growth. The aim is to find market front-runners early in their large price increases by checking they pass a fixed group of rules before any trade is reviewed. This method sorts for stocks already in firm upward directions, supported by getting better profits and revenue, thus concentrating on firmness and speed instead of trying to buy declining stocks.
A recent filter made to find such chances joined Minervini's basic Trend Template with a sort for firm growth speed. This two-part method tries to separate companies that are not only sound in chart terms but also showing the fast basic traits that often come before large price gains.
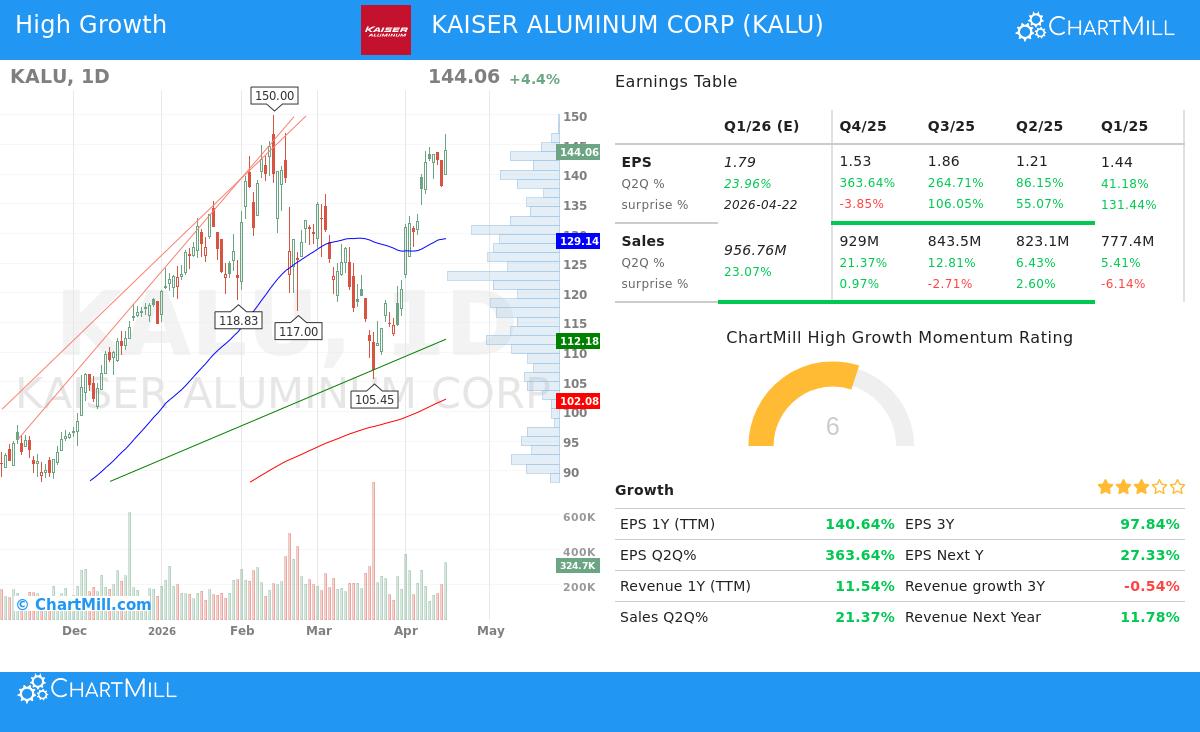
Why Kaiser Aluminum Corp. (NASDAQ:KALU) Matches the Trend Template
The base of the Minervini plan is the Trend Template, a group of fixed chart conditions that verify a stock is in a clear, continuing upward direction. Using the given information, Kaiser Aluminum seems to meet these important measures:
- Price Above Important Moving Averages: The stock's last price of $144.06 trades well above its rising 50-day ($129.14), 150-day ($109.34), and 200-day ($102.08) simple moving averages. This order is a main sign of continuing positive speed across all major time periods.
- Moving Average Order: The 50-day SMA is above both the 150-day and 200-day SMAs, and the 150-day SMA is above the 200-day SMA. This positive order, with shorter-term averages above longer-term ones, confirms a firm and steady upward direction.
- Nearness to Highs: An important rule of the plan is to concentrate on firmness, not low price. KALU, trading at $144.06, is within 4% of its 52-week high of $150.00 and is 174% above its 52-week low of $52.53. This shows firm recovery and leadership.
- Better Comparison to Market: With a ChartMill Comparison Score (CRS) of 94.64, KALU is doing better than about 95% of all stocks in the market. Minervini states that real market front-runners regularly show high comparison scores, pointing to large investor demand and industry leadership.
Reviewing the Firm Growth Speed Basics
While the Trend Template checks chart soundness, the "Firm Growth Speed" part of the filter looks into the basic engine that can push further price increase. Kaiser Aluminum's recent money measures show several speed increases that growth investors search for:
- Profit Growth Speed Increase: The company is showing notable year-over-year earnings per share (EPS) growth. The newest quarter saw EPS jump 363.6% compared to the same quarter last year. This comes after earlier quarters of 264.7% and 86.2% growth, pointing to a firm and speeding trend.
- Firm Yearly EPS Growth: On a full-year basis, EPS growth for the past twelve months is at 140.6%, a large gain from the -8.4% reported in the earlier financial year.
- Positive Profit Surprises: The company has passed analyst EPS guesses in three of the last four quarters, with an average pass of 72.2%. Steady positive surprises can be a reason for upward changes and more investor notice.
- Getting Better Profit Margins: After a drop, quarterly profit margins have shown step-by-step gain, rising from 2.78% three quarters ago to 3.04% in the newest report. Growing margins suggest getting better business efficiency and price control.
- Strong and Growing Revenue: Revenue growth has also sped up, with the latest quarter up 21.4% year-over-year, a notable increase from the 5.4% growth seen three quarters before.
These basic parts are key within the Minervini structure. He suggests that "large profits draw large notice." Speeding growth, especially when it surprises above guesses, pulls large investor buying that can feed the firm, continuing price moves the chart template is made to find early.
Chart Soundness and Present Position
A look at the ChartMill Technical Report for KALU gives a combined view. The stock gets a perfect Chart Rating of 10/10, showing excellent chart soundness. The report states both long-term and short-term directions are positive, the stock does better than 94% of the market, and it is trading near 52-week highs. It is in the Metals & Mining industry, where it does better than 81% of similar companies.
However, the report also gives a note of care for immediate entry. The Position Quality rating is a low 3, showing that while the direction is perfect, the stock's price movement has been changeable lately, trading in a wide band over the past month. This makes finding a low-risk, exact entry point hard now. For a strict Minervini-style trader, this hints the stock is one to watch closely for a possible calm or changeable period pattern that would give a better-chance position, instead of one to buy quickly at present levels.
Finding Like Chances
The joining of strict trend-following and growth speed filters can regularly find new possible picks as market states change. For investors interested in using this two-rule filter to the present market, you can view the live results and method here: Firm Growth Speed + Trend Template Filter.
End
Kaiser Aluminum Corp. shows a clear example of a stock that fits the ideas of direction-centered, growth speed investing. It clearly meets the strict chart rules of the Minervini Trend Template, showing a firm upward direction supported by better comparison to the market. Basically, it shows the kind of speeding profit and revenue growth that can act as a continuing reason. The main thought for investors, as shown by the chart report, is timing. The stock's recent changeable nature shows the importance of the "Specific Entry Point" part of the SEPA plan, reminding investors that even very good picks need a strict method to risk control and entry action.
Notice: This writing is for information and learning only. It does not make up investment advice, a suggestion, or an offer to buy or sell any security. The study is based on given information and certain methods, but past results are not a sign of future results. Investors should do their own review and talk with a skilled money advisor before making any investment choices. Please read our full notice here.