
The approach known as value investing has been a cornerstone of portfolio strategy for nearly a century, popularized by Benjamin Graham and later championed by investors like Warren Buffett and Charlie Munger. The core idea is straightforward: find companies whose current market price is lower than their intrinsic worth. The challenge, of course, lies in accurately identifying that gap. To help narrow the field, we ran a 'Decent Value' screen using ChartMill’s fundamental analysis tools. This screen specifically looks for stocks with a strong valuation rating (above 7 out of 10), while also ensuring the company maintains decent scores for profitability, health, and growth. The theory is that a stock can be cheap for a reason—but the metrics suggest ITRON INC (NASDAQ:ITRI) might be hiding genuine value beneath the surface.
Valuation Metrics
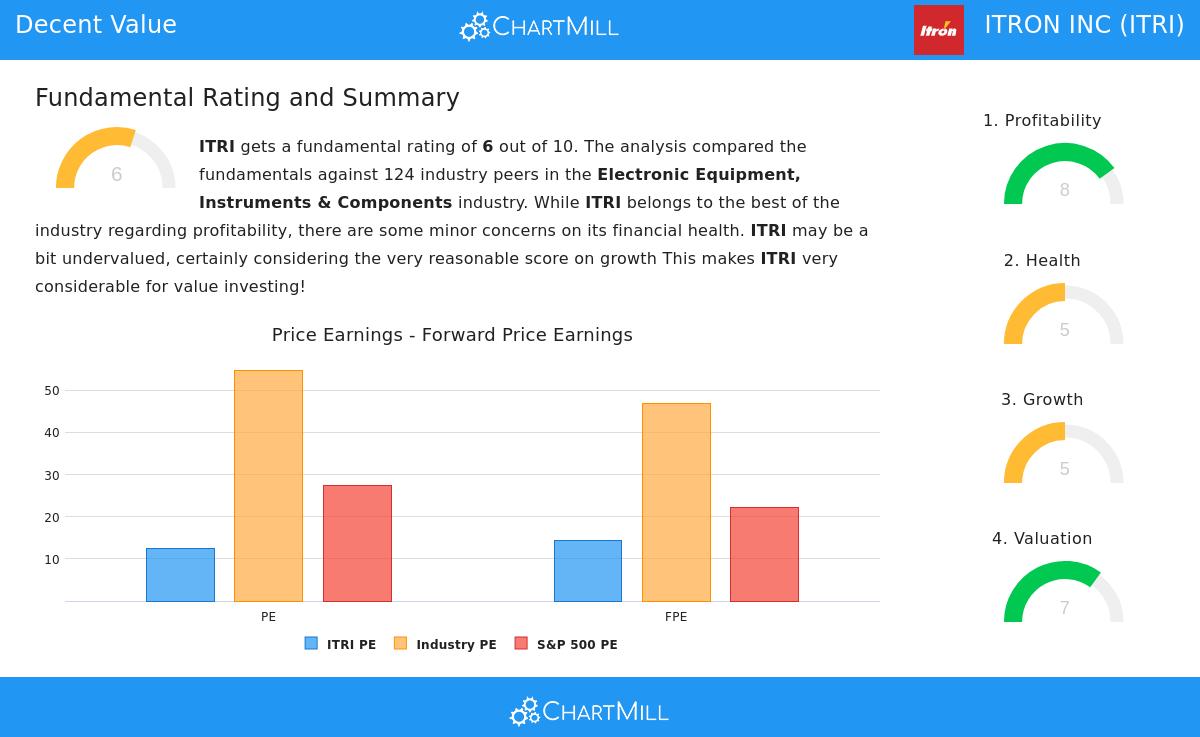
From a value perspective, ITRI stands out quite clearly. The company’s ChartMill Valuation rating sits at a solid 7 out of 10, which is the primary filter for our screen. Looking deeper at the specific ratios reinforces why this score is so high:
- Price/Earnings (P/E) Ratio: At 12.40, ITRI is cheaper than a staggering 91.94% of its peers in the Electronic Equipment, Instruments & Components industry. For context, the average P/E for the S&P 500 is around 27.42.
- Forward P/E: The future looks similarly priced. With a Forward P/E of 14.43, the stock remains cheaper than 85.48% of industry competitors, compared to an S&P 500 Forward P/E average of 22.24.
- Enterprise Value to EBITDA (EV/EBITDA): Based on this metric, ITRI is cheaper than 83.87% of its industry peers.
- Price to Free Cash Flow (P/FCF): This is perhaps the most compelling valuation metric, where ITRI is cheaper than 92.74% of its industry.
For a value investor, these ratios are not just numbers—they represent the 'Margin of Safety' discussed in Graham’s methodology. The wide gap between ITRI's market price and its intrinsic value (as implied by these multiples) suggests the market is not fully pricing in the company's underlying earning power and cash generation.
Profitability and Operational Strength
A low valuation is only attractive if the company is actually profitable. Here, ITRI earns a strong Profitability rating of 8 out of 10, which provides the fundamental support for the valuation thesis.
- Return on Equity (ROE): At 17.54%, ITRI outperforms 89.52% of its industry, indicating management is very effective at turning shareholder equity into profit.
- Return on Assets (ROA): A 8.09% ROA places ITRI in the top 87.10% of the industry.
- Margins: The company has a Profit Margin of 12.72% and an Operating Margin of 13.27%, both among the best in the sector. Furthermore, the Operating Margin has improved consistently in recent years, a sign of improving operational efficiency.
“Value traps” often occur when a stock looks cheap but the business is deteriorating. However, ITRI’s high profitability scores suggest its cheap valuation is not due to poor operations, but rather a potential market mispricing.
Financial Health and Solvency
Value investors also need a safety net. There is little point in buying a cheap stock if the company is drowning in debt. ITRI’s Health rating is 5 out of 10, which is decent but warrants closer inspection.
- Debt to Free Cash Flow: A very strong 3.26 years to pay back all debt. This is better than 70.16% of its industry peers.
- Debt to Equity: At 0.46, the company is not overly reliant on debt financing.
- Altman-Z Score: The score of 2.39 indicates only a limited risk of bankruptcy, though it is below the median of its industry peers.
- Liquidity: A Current Ratio of 1.80 and a Quick Ratio of 1.56 suggest adequate liquidity to cover short-term obligations.
While the overall health score is moderate, the key solvency metrics—especially the cash flow coverage—show that ITRI has a manageable debt load. This is an important quality for value investors, as it reduces the risk of financial distress during market downturns.
Growth Prospects
To bridge the gap between current undervaluation and future price appreciation, a company needs growth. ITRI’s Growth rating of 5 out of 10 presents a mixed, but interesting picture.
- Past Performance: The company has delivered impressive growth historically. Earnings Per Share (EPS) grew by 26.60% over the past year and at an average rate of 30.87% per year over the longer term.
- Future Estimates: Analysts expect forward EPS growth of 6.89% per year and Revenue growth of 6.07% per year.
- The Trajectory: While the EPS growth rate is expected to decelerate compared to the past, the Revenue growth rate is actually accelerating. This suggests that the company is sacrificing some short-term margin expansion to scale the top line, which could pay off in the long run.
For the value investor, the past explosive growth confirms the company has strong operational DNA. The slower, but positive, forward growth—combined with the very low valuation—creates a scenario where even modest growth can lead to significant price re-rating.
Analyst Views and the Value Case
The aggregation of these metrics suggests that ITRON INC (NASDAQ:ITRI) is a textbook candidate for further value research. It combines a dirt-cheap valuation (specifically on price-to-earnings and price-to-free-cash-flow bases) with industry-leading profitability. The balance sheet is solid enough to provide a margin of safety.
Taking everything into account, ITRI scores 6 out of 10 in our complete fundamental analysis report. While the growth is expected to moderate and the health score is not perfect, the combination of an excellent valuation (7/10) and high profitability (8/10) is rare. It suggests a company that is both cheap and good at what it does—the sweet spot for value-oriented investors.
Further Screening and Discovery
The 'Decent Value' screen used to find ITRI was just one example of how systematic fundamental analysis can uncover potential opportunities. If you are interested in replicating this strategy or adjusting the criteria to fit your personal risk tolerance, you can explore a live version of this screen.
Click here to view the Decent Value Stocks Screen with current results. This link will take you directly to the ChartMill stock screener where you can review the criteria and see which other stocks pass the filter today.
Disclaimer: This article is for informational and educational purposes only and does not constitute investment advice. Past performance and screen results are not indicative of future results. Always conduct your own research and consult with a qualified financial advisor before making any investment decisions.