
For technical investors, finding stocks that are in a solid uptrend and ready for their next increase is a central method. One organized process uses filters for stocks that have both a high "Technical Rating" and a high "Setup Quality Rating." The Technical Rating, usually a score of 7 or more, shows a stock is in a good, confirmed uptrend. The Setup Quality Rating, also best above 7, shows the stock is pausing in a narrow area after a previous rise, forming a possible base for a new upward move. This technique centers on joining solid trends at good times, trying to take part in momentum while controlling risk with clear entry and exit levels.
Technical Strength: A High-Level Trend
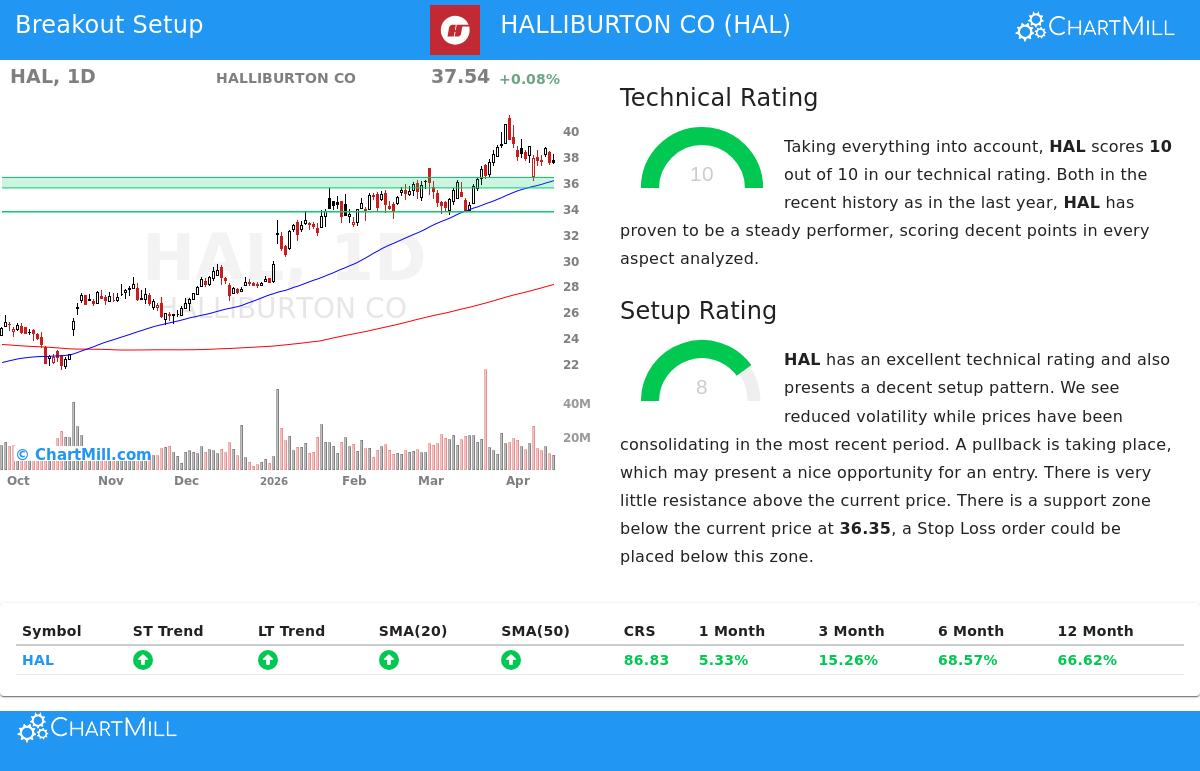
Halliburton Co (NYSE:HAL) is notable right away with a complete ChartMill Technical Rating of 10 out of 10. This high score is the base of the positive view and shows very good technical condition across many time periods. A close look at the technical report shows the reasons for this high rating.
- Trend Agreement: Both the long-term and short-term trends for HAL are marked as positive. This agreement is important for the method, as it shows continued buying without major opposing weakness.
- Moving Average Backing: The stock price is above all its main simple moving averages (20, 50, 100, and 200-day), and each average is in a rising pattern. This layered positive agreement shows steady backing at higher points.
- Market Comparison Strength: With a yearly gain better than 86% of all stocks, HAL shows clear relative strength. This is a main idea of momentum investing, as it shows the stock is a market frontrunner, not just moving up with a rising market.
This group of elements answers the main "which stock" question for technical investors. A rating of 10 confirms HAL is in a solid, maintained uptrend, making it a choice for more study instead of a stock in a resting or falling stage.
Setup Quality: Pause Before the Next Action
While a solid trend is needed, it is not enough for a best entry. A stock can be stretched, making a new buy risky. This is where HAL's Setup Quality Rating of 8 becomes important. This high score speaks to the "when to buy" question by pointing out a constructive halt in the trend.
The technical report states that HAL has been moving in an area between $35.27 and $41.18 over the last month and is now pausing in the middle of this area. This time of lower volatility and sideways movement after a solid rise is classic pause behavior. For the breakout method, this forms a clear structure:
- A Clear Resistance Point: The recent high near $41.18 sets a clear point to observe. A firm move above this point could show the restart of the main uptrend.
- A Set Support Area: The study finds a major support area between $35.54 and $36.35, made by a combination of moving averages and trendlines. This gives a logical area below the present price to set a protective stop-loss order, setting the trade's risk.
- Lower Volatility: The pause has caused smaller price changes, which often comes before a major directional move. The setup indicates the stock is tightening, possibly building force for its next upward move.
A Sample Trade Plan
From this study, the technical report describes a possible trade plan. It proposes an entry point just above the recent pause at $39.36, with a stop-loss order set at $36.04, just under the found support area. This structure sets the theoretical maximum risk to about 8.45% on the trade. It is a specific example of how the technical and setup ratings can become a usable plan with set risk.
Finding Other Chances
HAL offers a clear example of a stock fitting the strict needs of high technical and setup ratings. For investors looking to search the market for similar possible breakout setups each day, the process is organized. The Technical Breakout Setups filter is made to find these exact situations, giving a selected starting point for more research.
You can find new, daily results from this filter and study them closely here.
,
Disclaimer: This article is for informational purposes only and does not constitute investment advice, a recommendation, or an offer to buy or sell any security. The trade plan mentioned is an automatically generated example for educational illustration and is not an endorsement. Always conduct your own due diligence, consider your financial situation and risk tolerance, and consult with a qualified financial advisor before making any investment decisions. Past performance is not indicative of future results.