
For investors using a technical breakout strategy, the process often focuses on two central questions: which stock to buy and when to buy it. A methodical way to answer these questions involves looking for stocks that show both technical health and a constructive price pattern. The aim is to find leading stocks that are pausing after a previous rise, providing a possible entry point for a further move up. This approach selects for a high technical rating, pointing to a solid existing trend, paired with a high setup quality rating, which marks a phase of tight consolidation that might come before a breakout.
Technical Strength: A Base of Momentum
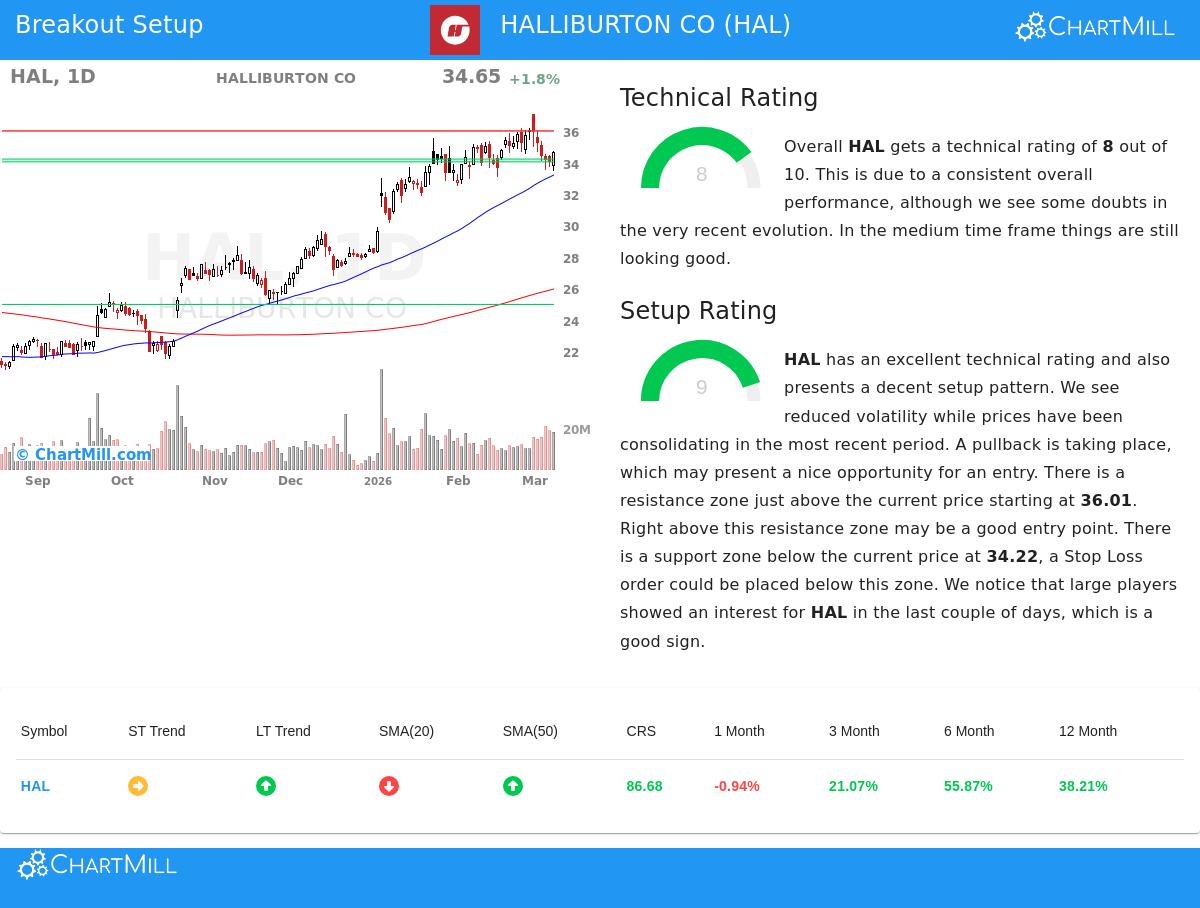
Halliburton Co (NYSE:HAL) offers a strong example from a trend-following viewpoint. Based on its ChartMill Technical Analysis report, the stock receives a technical rating of 8 out of 10. This score measures the stock's overall technical condition, and a number above 7 usually means a stock is in a confirmed uptrend. The report lists several factors behind this health:
- Long-Term Trend: The long-term trend for HAL is rated as positive, an important base for any breakout candidate as it implies the larger momentum is supportive.
- Relative Performance: In the last year, HAL's performance has been better than 86% of all other stocks, showing notable relative strength. This is a main feature of leading stocks targeted in breakout strategies.
- Position vs. Market: The stock is trading in the upper portion of its own 52-week range, matching the S&P 500, which is also in the upper part of its range. This shows HAL is moving with, not behind, the general market rise.
This mix of a positive long-term trend and better relative strength is exactly what the technical breakout approach looks for. It favors stocks that are already showing momentum, based on the idea that they are more probable to keep rising than to turn down.
Setup Quality: The Pattern for a Chance
While technical health finds the "which," the setup quality speaks to the "when." HAL has a very good setup rating of 9, pointing to a high-grade consolidation pattern. This is where the chance for a planned-risk entry appears. The technical report notes a distinct and narrow trading range that has formed lately.
- Consolidation Zone: Over the past month, HAL has traded between $33.10 and $37.02. It is now trading near the lower part of this range, having moved down from recent highs.
- Defined Support and Resistance: The analysis finds a clear support area between $34.04 and $34.22, created by several trendlines. On the other side, nearby overhead resistance is seen at $36.01.
- Lower Volatility & Institutional Activity: The report mentions lower volatility during this pause, a typical signal of a possible base. Also, it indicates higher buying activity from large investors in recent days, frequently a sign of coming upward movement.
This pattern is standard for the breakout method. The stock has risen (shown by its high technical rating), stopped to consolidate in a small range (shown by the high setup rating), and is now positioned near support with resistance clearly marked above. This forms a situation where a trader can design a specific entry just above the resistance level, with a stop-loss order set just below the noted support area.
A Specific Trading Plan
From this analysis, the technical report proposes a possible trade plan. An entry might be thought about on a move above the $36.01 resistance level, using a buy-stop order. A stop-loss could be set below the support area near $34.03, setting the trade's risk to about 5.5%. This organized plan shows how the technical and setup ratings are used to go from finding a stock to acting on it.
Finding Other Breakout Possibilities
The screening method that found Halliburton is used each day on the wider market. Investors searching for an updated list of possible technical breakout patterns can locate them by using the same screen. View today's technical breakout patterns here.
Disclaimer: This article is for informational purposes only and does not constitute investment advice, a recommendation, or an offer to buy or sell any security. The trading plan mentioned is an automated, hypothetical example based on technical indicators and is not a guarantee of future performance. Always conduct your own research, consider your risk tolerance, and consult with a qualified financial advisor before making any investment decisions. Past performance is not indicative of future results.