
Graham Corp (NYSE:GHM) has recently appeared on a specific stock screen made to find companies that join notable technical momentum with solid fundamental growth. This screen uses the ideas of Mark Minervini's Trend Template, a structured way to see stocks in clear uptrends, and adds a High Growth Momentum (HGM) rating to confirm the basic business is showing faster financial results. The aim is to locate securities where a notable price trend is supported by getting better corporate foundations, a pairing that has in the past been a sign of stocks that lead the market.
The Minervini method notes that the largest stock market successes are almost always in a clear Stage 2 advance, a continued uptrend, before they make their largest price jumps. The Trend Template gives a strict, rules-based filter to see these conditions, looking at price level compared to important moving averages, nearness to new highs, and better relative strength. When these technical signs match with faster earnings and sales growth, it frequently shows that institutional investors are buying shares expecting future results.
Fitting the Minervini Trend Template
A look at Graham Corp's chart and technical information shows it currently meets the main rules of the Minervini Trend Template, which clarifies its presence on the screen.
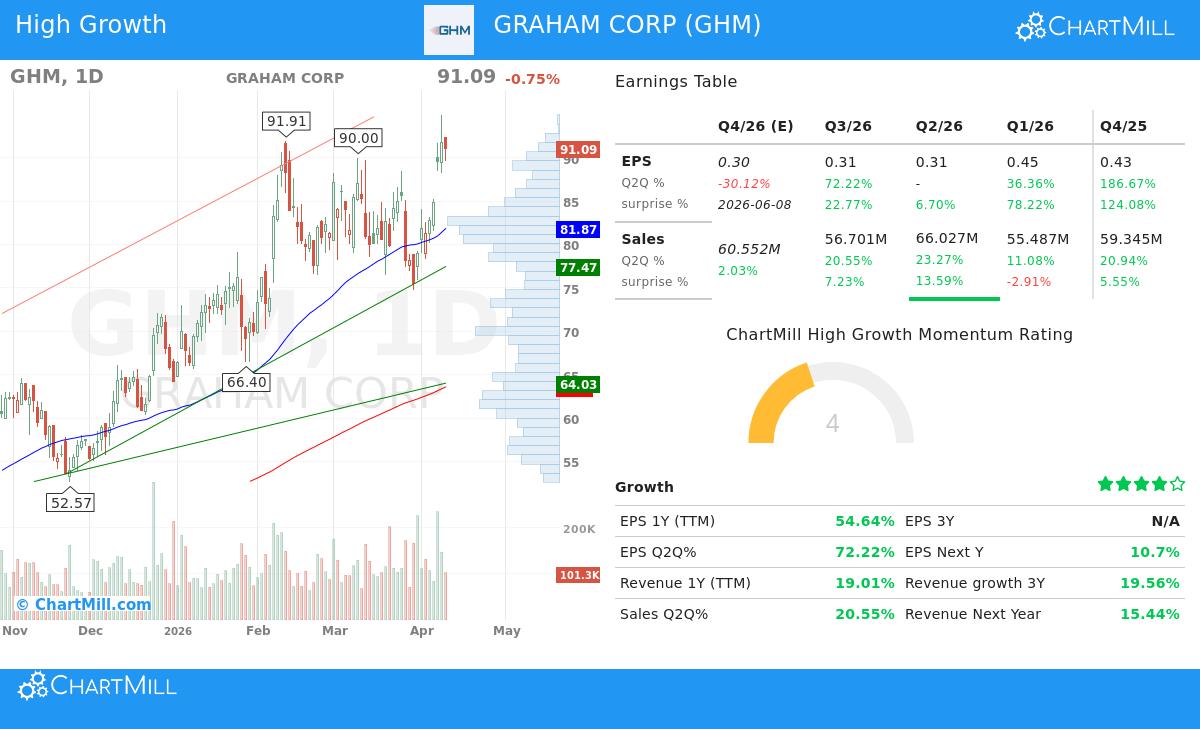
- Trend Position: The stock is trading notably above its rising 50-day ($81.87), 150-day ($67.77), and 200-day ($63.60) simple moving averages. Also, the 50-day average is above the 150-day, which is above the 200-day, making the "stacked" position that Minervini looks for as proof of a notable, steady uptrend.
- Nearness to Highs: GHM's last price of $91.09 is within 4% of its 52-week high of $94.92, easily meeting the "within 25% of the 52-week high" rule. More notably, the current price is about 220% above its 52-week low of $28.49, well past the 30% limit. This shows the stock has already had a notable rise and is holding near its top, a trait of leading stocks.
- Better Relative Strength: With a ChartMill Relative Strength (CRS) score of 96.57, GHM is doing better than nearly 97% of all stocks in the market. More significantly, inside its Machinery industry, it does better than 99% of its 131 competitors. Minervini regularly points out that the top performers are usually sector or market leaders, and a high RS rating is a measurable sign of that leadership.
These technical items together show a stock in a leading uptrend. The positive long-term and short-term trends mentioned in the technical report, along with major outperformance over the past 12 months (+204%), confirm that GHM is showing the type of price strength the Trend Template is made to find.
Foundations Backing High Growth Momentum
While the Trend Template deals with the "when," the High Growth Momentum rating tries to answer the "why" by looking at the fundamental driver behind the price movement. For Graham Corp, several important measures indicate the recent momentum may be supported by real business gains.
- Earnings Speed: The company has shown outstanding earnings growth. EPS growth on a trailing twelve-month (TTM) basis is over 54%, and the last reported quarter showed year-over-year EPS growth of 72.2%. Possibly most notable is the pattern of earnings surprises; GHM has surpassed analyst EPS estimates in each of the last four quarters, with an average beat of nearly 58%. This habit of regularly beating expectations is a notable force that draws investor notice.
- Revenue Growth: Top-line growth is also present, with TTM revenue growth of 19% and last quarter's sales growing over 20% year-over-year. This shows the earnings growth is not only from reducing costs but is helped by rising demand for its products.
- Analyst Changes: A small but important sign is the upward change in estimates. The average analyst estimate for next year's EPS has been changed upward by 6.5% over the last three months. As Minervini states, upward changes often come before more price gains as they show increasing belief in the company's future outlook.
- Profit Margin Growth: The company's net profit margin has grown notably, from 0.25% two fiscal years ago to 5.83% in the last reported full year. Getting better margins suggest strong pricing and operational effectiveness, key features of a business building strength.
Technical Condition and Current Position
According to ChartMill's own analysis, GHM gets a perfect Technical Rating of 10 out of 10, showing "a consistent performance in both the short and longer term time frames." This top rating confirms the stock's technical condition is outstanding. However, the analysis also gives a note of care for immediate buying: the Setup Quality rating is currently a 3. The report says that while the technicals are excellent, "it does not present a decent entry opportunity at the moment. Price movement has been a little bit too volatile to find a nice entry and exit point."
This points out a key part of the Minervini method: seeing a strong trend is only the first step. The actual trade is started at a specific entry point, often after a volatility contraction pattern (VCP) or a breakout from a tight holding pattern. For GHM, the suggestion is to wait for such a holding pattern to form, allowing for a clearer view of risk with a closer stop-loss. The technical report finds several support areas below the current price, which would become important for handling a position if a suitable setup appears.
You can review the full, detailed technical analysis for GHM here.
Summary
Graham Corp offers a notable example of a stock that fits the ideas of growth and momentum investing. It meets the strict technical rules of the Minervini Trend Template, confirming its place as a market leader in a notable uptrend. This price strength is supported by fundamental measures that signal high growth momentum, including faster earnings, regular positive surprises, and getting better profitability. While the current stretched price action suggests waiting for a more ideal entry setup, GHM shows the kind of security that systematic screens are made to find: one where notable technicals and improving foundations come together.
Locate Comparable Chances
Graham Corp was found using a preset screen that joins the Minervini Trend Template with a High Growth Momentum filter. You can run this screen yourself to find other stocks currently showing this notable mix of features.
,
Disclaimer: This article is for informational and educational purposes only. It is not a recommendation to buy or sell any security. The analysis is based on data and methods thought to be reliable, but its accuracy cannot be guaranteed. Investing involves risk, including the possible loss of principal. Always do your own research and think about your financial position and risk tolerance before making any investment decisions.