
In the field of systematic stock selection, joining a strict technical system with strong fundamental growth measures can be an effective method for finding possible leaders. One method comes from the work of famous trader Mark Minervini, whose Trend Template gives a fixed list to confirm a stock is in a clear, strong uptrend. When this technical rule is joined with an emphasis on high-growth momentum, looking at quickening earnings, growing profit margins, and firm revenue trends, the aim is to find companies that are both moving well on the chart and showing fundamental quality that may support more price gains.
GENERAL ELECTRIC (NYSE:GE) offers a strong example for this joined method. As a changed company now centered directly on aerospace and defense through GE Aerospace, it has completed its long restructuring with a clearer business model and refreshed financial health. We will look at how its present position fits both the technical rule of the Trend Template and the strict needs of high-growth momentum investing.
Looking at the Technical Base: The Minervini Trend Template
Mark Minervini's Trend Template is made to sort for stocks showing clear strength, making sure an investor only looks at equities where demand controls supply across various time periods. The template's moving average rules are especially strict, needing a particular bullish order. A look at GE's present technical state shows it matches these important points:
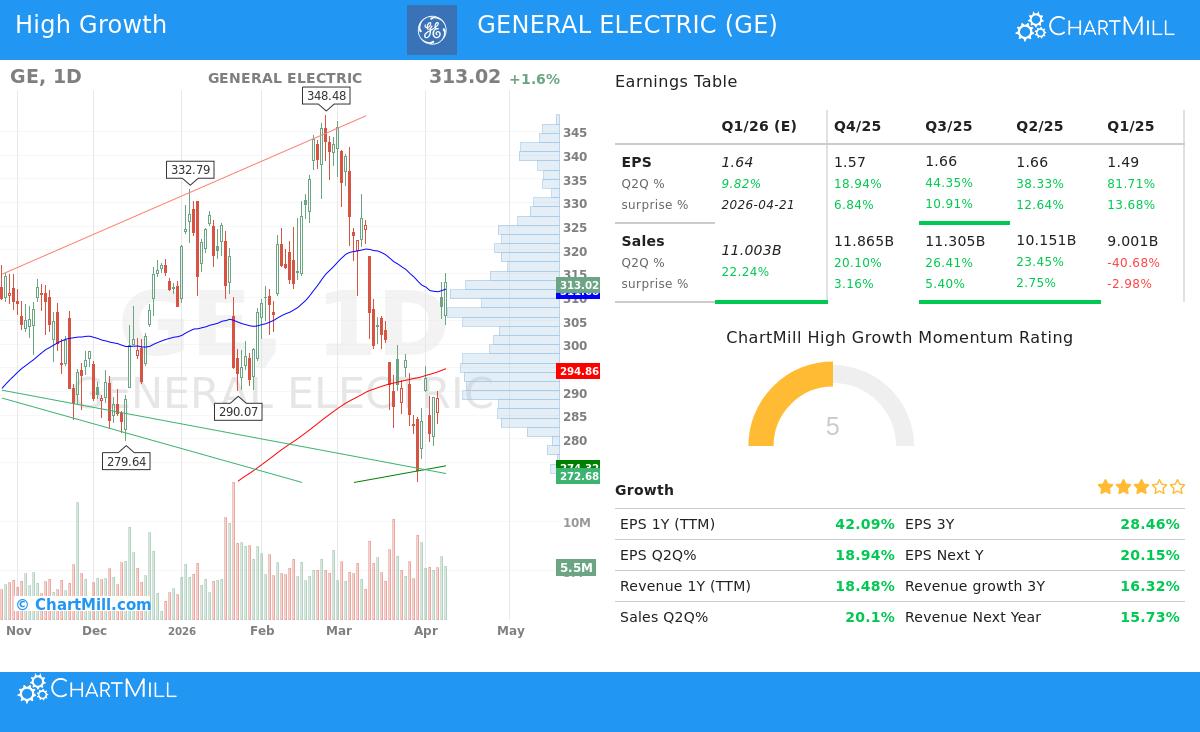
- Price Above Key Averages: GE's last price of $313.02 trades above its rising 50-day ($311.68), 150-day ($304.92), and 200-day ($294.86) simple moving averages (SMAs). This meets the template's first need that price action is firm on both medium and long-term scales.
- Correct Moving Average Order: The 50-day SMA is above both the 150-day and 200-day SMAs, and the 150-day SMA is also above the 200-day SMA. This "stacked" order is a standard sign of a sound, advancing uptrend and is a central idea of Minervini's method to confirm building momentum.
- Nearness to Highs: An important mental filter in the Trend Template is a stock's place compared to its 52-week range. GE, trading at $313.02, is over 30% above its 52-week low of $176.02 and within 25% of its 52-week high of $348.48. This shows the stock is behaving like a market leader, showing strength instead of healing from serious weakness.
- Better Relative Strength: Maybe most importantly, GE has a ChartMill Relative Strength (CRS) rating of 84.62. This means it has done better than about 85% of the market over the last year. Minervini states that real leaders regularly do better than the wider market, and a high RS rating is a required filter for finding them.
These technical facts together indicate GE is in a clear Stage 2 advance, the exact period where Minervini's study shows the largest gains often happen.
Judging the Growth Driver: High Growth Momentum Fundamentals
A firm chart needs to be backed by a solid fundamental story. The High Growth Momentum (HGM) part of the screen looks for companies showing not only growth, but quickening and high-quality growth. GE's recent financial numbers show several good trends that match this thinking.
Earnings Strength and Quickening: The company is providing strong and better profitability. Trailing twelve-month (TTM) earnings per share (EPS) are at $6.38, showing a solid year-over-year growth of 42.1%. More importantly, the quarterly change shows quickening: year-over-year EPS growth has increased from 38.3% two quarters ago to 44.3% last quarter and 18.9% in the most recent quarter (though the most recent quarter shows a slowing from the prior period's high rate, the multi-quarter trend stays firm). The company has also passed analyst EPS estimates in each of the last four quarters by an average of over 11%, showing steady operational overperformance.
Revenue Growth and Margin Growth: Top-line growth is also strong, with TTM revenue up 18.5% year-over-year. Recent quarterly sales growth has been firm, at 20.1% in the latest quarter. This is backed by a firming profit margin position. The last reported quarterly profit margin was 20.0%, showing a step-by-step improvement and adding to a full-year margin of 19.0%, up from 16.9% the year before. This mix of rising sales and growing margins is a standard mark of a company gaining operational leverage and pricing strength.
Analyst Trust and Cash Flow: The fundamental story is further supported by positive analyst feeling. Estimates for both next year's EPS and revenue have been moved up over the past three months by about 3.2% and 3.5%, in that order. Also, the company's free cash flow per share has almost doubled year-over-year, growing by 97.5% to $6.95, giving good financial room for investments, debt lowering, or shareholder returns.
Technical Soundness and Present Position
Based on ChartMill's own analysis, GE is given a firm Technical Rating of 7 out of 10. The report states that GE has been one of the better performers over the past year, with a 12-month return over 72%. The long-term and short-term trends are now judged as neutral, indicating a time of consolidation inside the larger uptrend. The analysis finds key support near the $271-$274 area and resistance around the $343-$346 zone, which matches the recent 52-week high.
However, the report also gives an important note on timing: while the technical rating is firm, the Setup Quality Rating is low at 1. This shows that after its firm run, the stock is now stretched and not in an immediate, low-risk consolidation shape good for a new entry. For investors following a ruled strategy like Minervini's, this indicates waiting, allowing for a constructive pullback or a new volatility tightening shape to form would be the careful path before thinking about an entry. You can see the full, detailed technical study here: ChartMill Technical Report for GE.
Locating Related Chances
GE shows the kind of company that appears when using a double view of technical trend strength and fundamental growth momentum. For investors wanting to find other stocks that now match this strict group of needs, the preset screen is ready for more study.
→ Look at the "High Growth Momentum + Trend Template" Screen for More Ideas
Final Points
General Electric (GE) shows a strong match with a strategy that values both technical leadership and fundamental growth. Its chart order meets the strict Minervini Trend Template, confirming a part in a continued uptrend with better relative strength. Fundamentally, the company is showing quickening earnings, firm revenue growth, growing margins, and strong cash flow creation, signs of a high-momentum business. While the present technical position indicates the stock may be ready for a time of consolidation, its basic position makes it a company worth close watch for investors centered on finding growth leaders inside clear uptrends. As usual, more individual study on the company's specific view, competitive place, and wider sector trends is needed.
Disclaimer: This article is for information and learning only. It does not form a suggestion to buy, sell, or hold any security. The analysis is based on given data and specific screening methods. All investing includes risk, including the possible loss of principal. You should do your own study and think about talking with a qualified financial advisor before making any investment choices. Please read our full disclaimer here.