
Investors looking to find market leaders with strong growth potential frequently use methods that join strict technical study with fundamental health. One example is the Mark Minervini method, which uses a defined Trend Template to find stocks in strong uptrends and pairs it with an emphasis on excellent earnings and sales momentum. This process tries to identify stocks early in their large price increases by confirming they are technically healthy and fundamentally improving. A recent filter using this two-part method has identified GigaCloud Technology Inc, Class A (NASDAQ:GCT) as a candidate for more review.
Following the Minervini Trend Template
The central part of Minervini's technical filtering is his Trend Template, a group of fixed rules made to select for stocks in a confirmed Stage 2 uptrend. GigaCloud Technology's present chart shape matches these rules closely, which is important for the method as it confirms one is only trading in the direction of the existing, institution-supported momentum.
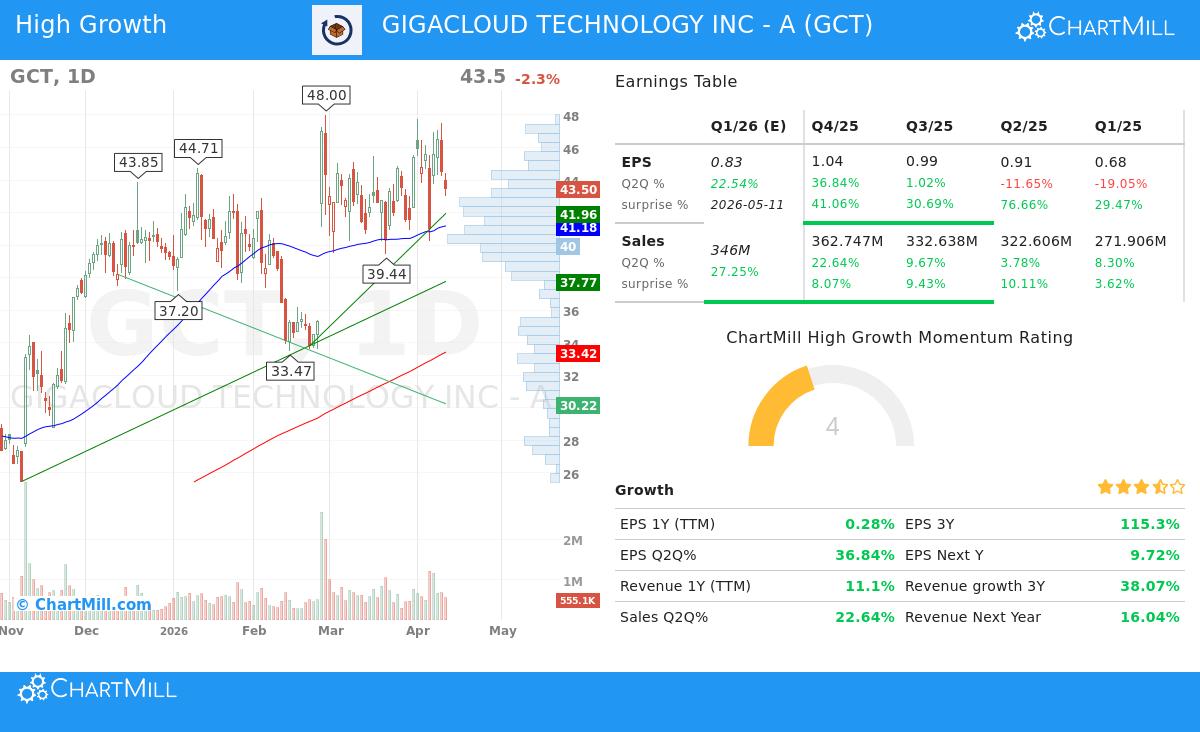
- Moving Average Arrangement: The stock's price is trading above all main simple moving averages (SMAs), the 50-day ($41.18), 150-day ($36.37), and 200-day ($33.42). Also, these averages are in the correct bullish order: the 50-day SMA is above the 150-day, which is above the 200-day. This ordered arrangement shows continued buying pressure across several time periods.
- Nearness to Highs: A central Minervini principle is to concentrate on strength, not low price. GCT is presently trading within 10% of its 52-week high of $48.00, meeting the "within 25% of the high" rule. At the same time, the current price is more than 260% above its 52-week low, greatly passing the "30% above the low" limit, indicating a strong recovery and set uptrend.
- Excellent Relative Strength: Leadership is critical. GCT has a ChartMill Relative Strength (CRS) score of 96.92, meaning it has done better than about 97% of all stocks over the last year. This outstanding relative strength is a sign of market leaders that Minervini looks for, often showing institutional support and industry leadership.
Fundamentals for Strong-Growth Momentum
While the Trend Template confirms a stock is technically prepared, the Minervini method requires a fundamental driver, specifically, speeding growth in earnings and sales. The given data indicates GCT shows several traits interesting to strong-growth momentum investors.
- Strong Earnings Growth: The company's trailing twelve-month (TTM) EPS is $3.62, showing a year-over-year growth of about 27.7%. More significantly, the most recent quarterly EPS grew 36.8% compared to the same quarter last year, showing a speed increase in profit.
- Steady Earnings Surprises: A main sign of fundamental momentum is a company's capacity to regularly beat analyst forecasts. GCT has exceeded EPS estimates in each of the last four quarters, with an average surprise of more than 44%. This series of positive surprises often leads to higher revisions and fresh investor attention.
- Healthy Revenue Increase and Profit: Revenue growth stays sound, with the latest quarter up 22.6% year-over-year. The company keeps good profit margins, with the last reported quarter at 10.6%. Also, analyst opinion is getting better, with the average estimate for next year's EPS revised upward by more than 6% in the last three months, a positive sign for future expectations.
- High Growth Momentum (HGM) Score: The filtering process specifically needed a minimum HGM score, which combines different growth and momentum factors. GCT's passing under this filter shows its fundamentals are not only healthy alone but are part of a wider, quantifiable momentum picture that growth investors aim for.
Technical Condition and Setup Review
Beyond the exact Trend Template, a wider technical study gives background for possible entry. According to ChartMill's own report, GCT receives a complete Technical Score of 10/10, showing excellent condition across long and short-term trends, moving averages, and relative performance. The long-term and short-term trends are both scored as positive, matching the wider market's long-term positive trend.
The report states the stock is trading in the higher part of its 52-week range and finds several close support areas, the nearest ranging from $41.18 to $41.96, which could act as a reasonable zone for a stop-loss order in a trading plan. While the Setup Quality score is a medium 5, the summary states "reduced volatility while prices have been consolidating," which can come before a new directional move. For a complete breakdown of the support, resistance, and detailed study, readers can examine the full technical report for GCT.
Summary and Additional Study
GigaCloud Technology offers an interesting example of a stock that presently satisfies the strict technical rules of the Minervini Trend Template while also showing the fundamental earnings growth and momentum valued by strong-growth investors. Its strong price trend, leader-level relative strength, and speeding quarterly earnings form a combination of factors that methods like Minervini's are built to identify.
It is vital to recall that this study finds a possible setup based on past and present measures. Any investment choice needs more individual research, including a review of the total market condition, industry health, and specific company dangers. The Volatility Contraction Pattern (VCP), a main entry part in Minervini's method, should be found on the chart to locate a low-risk entry point.
For investors curious about finding other stocks that presently match this mix of strong-growth momentum and healthy technical trends, you can examine the preset filter via this link: High Growth Momentum + Trend Template Screen.
Disclaimer: This article is for informational and educational purposes only and does not form investment advice, a suggestion, or an offer or request to buy or sell any securities. The study is based on given data and certain methods; past performance is not a guide for future results. Investors should do their own research and talk with a qualified financial advisor before making any investment choices.