
For investors looking for chances where the market price may not completely show a company's inherent strength, a disciplined screening method can be a helpful first step. One such technique looks for equities that join a good price with firm basic business measures. This approach seeks stocks that are low-priced compared to their field or the wider market, but importantly, not because they are unsound. Instead, the attention is on companies that keep acceptable earnings, a sound money standing, and fair growth chances, the signs of a possible value find rather than a value trap.
GENPACT LTD (NYSE:G) comes up as a pick from this kind of screening. As a worldwide professional services company centered on digital change, business process management, and outsourcing, Genpact works in a busy but necessary area. The main question for a value-focused investor is if the present stock price gives a good opening for a company with lasting business traits.
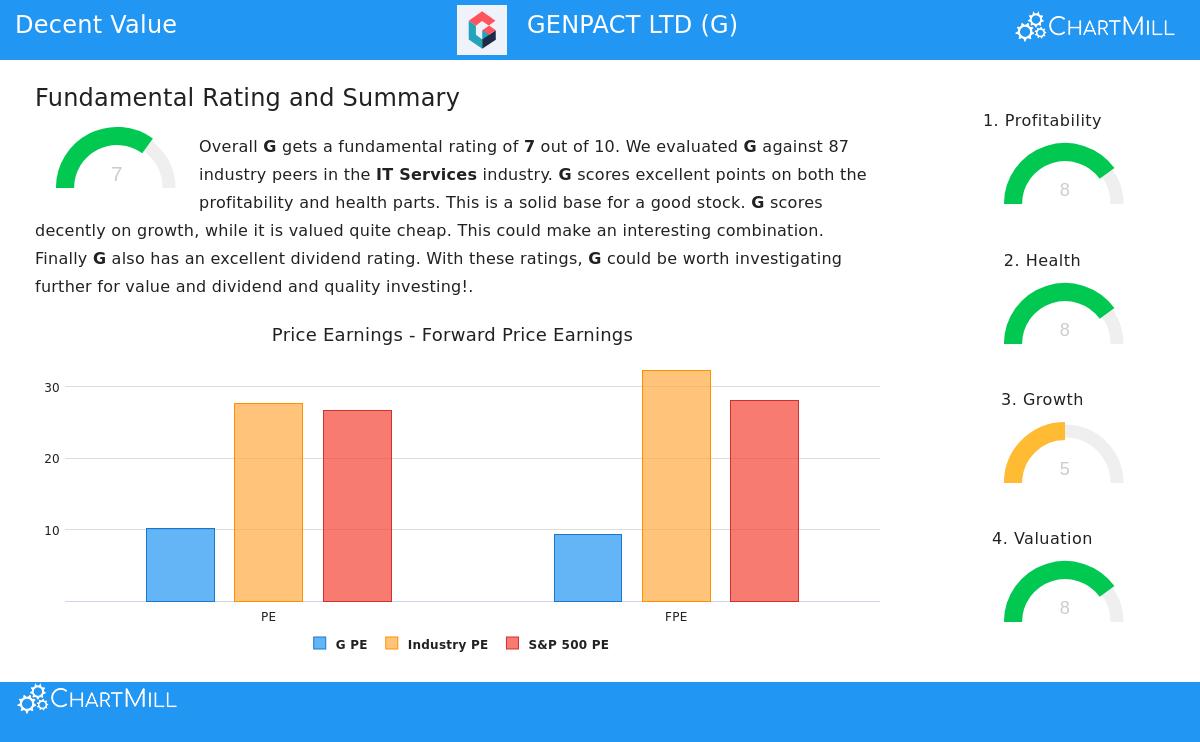
Valuation: The Base of the Idea
The main draw of Genpact is in its price measures, which seem low next to both similar companies and the wider market. For a value plan, a low price is the first screen; it shows the possible "markdown" an investor is receiving. Genpact's basics indicate this markdown exists.
- Price-to-Earnings (P/E) Ratio: At 10.21, Genpact's P/E ratio is seen as fair. More significantly, it costs less than about 82% of similar companies in the IT Services field, where the average P/E is above 27.
- Forward P/E Ratio: Looking forward, the price stays notable with a forward P/E of 9.27, which is less than almost 84% of field rivals.
- Comparison to Wider Market: Both the standard and forward P/E ratios are much under the present S&P 500 averages (26.68 and 28.06, in order), stressing its relative low cost in the bigger equity scene.
- Cash Flow & EBITDA Valuation: The good pricing reaches other measures. Based on its Price/Free Cash Flow and Enterprise Value/EBITDA ratios, Genpact is less costly than over 86% and 80% of its field peers, in order.
This grouped data shows a stock that the market is pricing cautiously. For the value investor, these ratios make the ground for spotting a low-priced case.
Financial Health: Checking the Base
A low-cost stock is only a sound investment if the company is financially stable. A poor balance sheet can make a low price into a lasting loss of money, the feared "value trap." Genpact's financial health grade is firm, getting an 8 out of 10.
- Liquidity Strength: The company shows solid short-term money flexibility with a Current Ratio and Quick Ratio both at 2.16. This means more than enough assets to cover near-term debts and does better than most of its field rivals.
- Debt Management: While its Debt/Equity ratio of 0.50 matches the field, more key checks show strength. Its Debt to Free Cash Flow ratio is a very good 1.69, meaning it could in theory pay off all its debt with under two years of cash flow. Analysts see this firm coverage lessens worries about the debt amount.
- Bankruptcy Risk: The Altman-Z score of 3.60 shows a financially healthy company with a low near-term chance of money trouble, grading better than about two-thirds of its peers.
This financial sturdiness gives a safety buffer. It indicates the company has the steadiness to handle economic shifts and the ability to put money into its business or give money back to shareholders.
Profitability: The Driver of Value Making
A low-priced company must also be able to make earnings. High earnings at a low price can be a strong mix. Genpact gets an 8 out of 10 for profitability, with several notable measures.
- Return on Capital: The company uses its capital well to make income. Its Return on Invested Capital (ROIC) of 14.13% and Return on Equity (ROE) of 23.12% are very good, doing better than about 89% and 86% of the field. A steadily high ROIC is a key sign of a lasting competitive edge.
- Getting Better Margins: Both its Profit Margin (10.88%) and Operating Margin (14.77%) are above field averages and, notably, have been getting better in recent years. This direction hints at good management and chance for widening earnings ability.
Firm and getting better profitability is needed for the value idea to work. It gives the basic earnings growth that, if seen by the market, could lead to price gains.
Growth and Dividend: The Extra Parts
While pure value stocks at times miss growth, Genpact shows an even profile. Its growth grade is a middle 5, but it shows steady, dependable increase.
- Earnings Growth: The company has increased its Earnings Per Share (EPS) by an average of 11.54% each year over recent years and by 14.02% in the last year. Analysts think this will keep going, guessing average yearly EPS growth of about 12% moving forward.
- Revenue Growth: Top-line growth has been stable in the mid-single digits, with a like speed guessed in the future. This points to a business that is growing naturally with its clients' needs.
- Shareholder Returns: Adding to the value view is a firm dividend, with a yield of 2.07% that is much above the field average. The dividend has grown at an average yearly rate of over 11% for ten years and is backed by a maintainable payout ratio.
This mix of modest growth and a dependable, increasing dividend puts another part to the investment case, giving both possible price gains and income while waiting for a possible price re-rate.
Conclusion
Genpact shows a case that fits key value investing ideas: a stock priced at a markdown to its field and the market, supported by a financially sound balance sheet, firm and getting better profitability, and a history of steady growth. It seems to be a business doing well that is not being priced by the market as such. The screening rules that found Genpact, focusing on price next to basic health and profitability, tries to screen out guesswork cases and focus on companies with clear strengths that may be briefly missed.
This study of Genpact is built on a particular screening method. Investors keen on looking at other stocks that meet like rules of good price, acceptable profitability, health, and growth can see the Decent Value Stocks screen on ChartMill.
Disclaimer: This article is for information only and does not make financial guidance, a suggestion, or a deal to buy or sell any security. The study is based on data and grades given by ChartMill. Investors should do their own full check, thinking of their personal money situation, risk comfort, and investment goals, before making any investment choices. Past results are not a sign of future results.