
FORTINET INC (NASDAQ:FTNT) has been identified as a potential breakout candidate by our technical screener. The stock shows a combination of solid technical health and a well-defined setup pattern, making it worth a closer look for traders.
Technical Strength
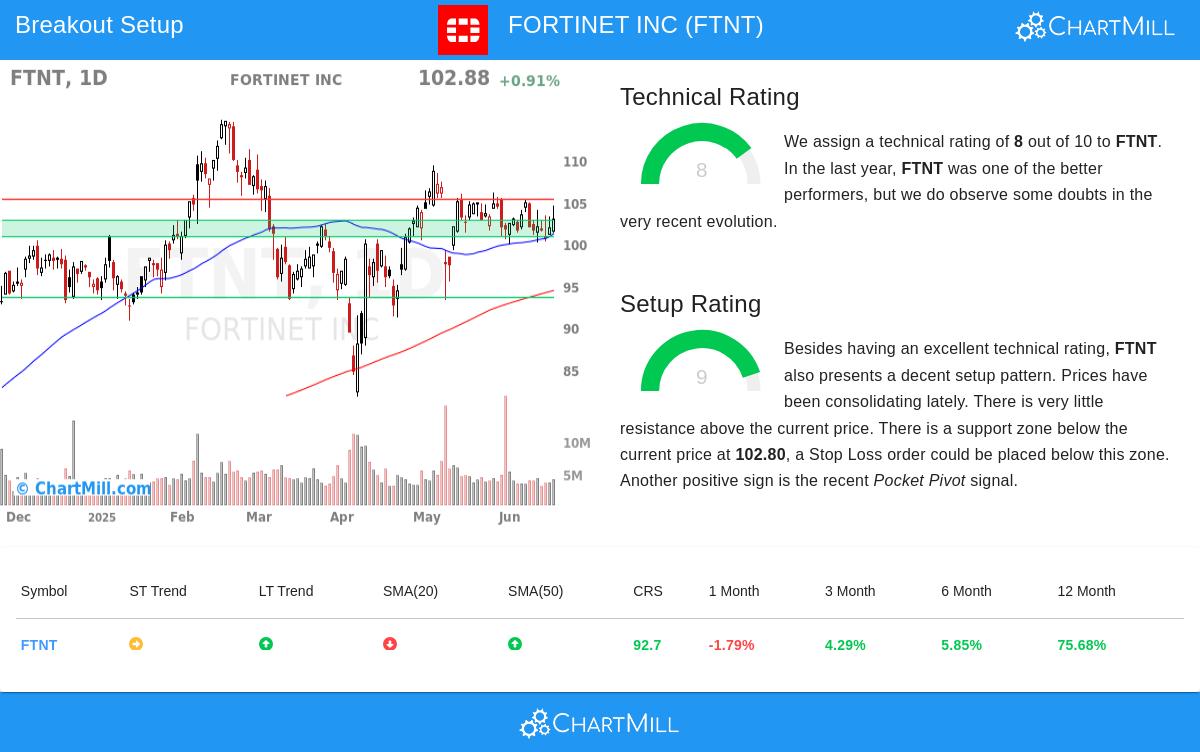
- Technical Rating of 8: FTNT scores well on overall technical health, supported by a positive long-term trend. While the short-term trend is neutral, the broader uptrend remains intact.
- Relative Strength: The stock outperforms 92% of all stocks over the past year, with gains distributed consistently. It also ranks above 85% of peers in the Software industry.
- Support Levels: Multiple support zones exist, including a key area between $100.83 and $102.80, backed by moving averages and trendlines.
Setup Quality
- Setup Rating of 9: FTNT is consolidating within a recent range ($99.85 - $106.06), presenting a potential entry point.
- Low Resistance: Minimal resistance lies above the current price, increasing the likelihood of an upward breakout.
- Pocket Pivot Signal: Recent volume patterns suggest accumulation, reinforcing the bullish case.
A possible trade setup suggests an entry above $105.31 (just above resistance) with a stop-loss below $100.82. This would limit downside risk to 4.26%.
For a deeper analysis, review the full technical report for FTNT.
Our Technical Breakout Setups screener updates daily with new opportunities.
Disclaimer
This is not investment advice. Always conduct your own research and consider risk management before trading.