
Our stock screener has identified FORTINET INC (NASDAQ:FTNT) as a potential breakout candidate. This technical breakout setup pattern occurs when the stock consolidates after a strong uptrend. While the actual breakout is uncertain, it may be worth keeping an eye on NASDAQ:FTNT.
Technical Analysis Observations
At ChartMill, a crucial aspect of their analysis is the assignment of a Technical Rating to each stock. This rating, ranging from 0 to 10, is calculated daily by considering numerous technical indicators and properties.
Taking everything into account, FTNT scores 8 out of 10 in our technical rating. In the last year, FTNT was one of the better performers, but we do observe some doubts in the very recent evolution.
- The short term is neutral, but the long term trend is still positive. Not much to worry about for now.
- Looking at the yearly performance, FTNT did better than 89% of all other stocks.
- FTNT is one of the better performing stocks in the Software industry, it outperforms 73% of 280 stocks in the same industry.
- FTNT is currently trading in the upper part of its 52 week range. The S&P500 Index is also trading in the upper part of its 52 week range, so FTNT is performing more or less in line with the market.
For an up to date full technical analysis you can check the technical report of FTNT
How does the Setup look for NASDAQ:FTNT
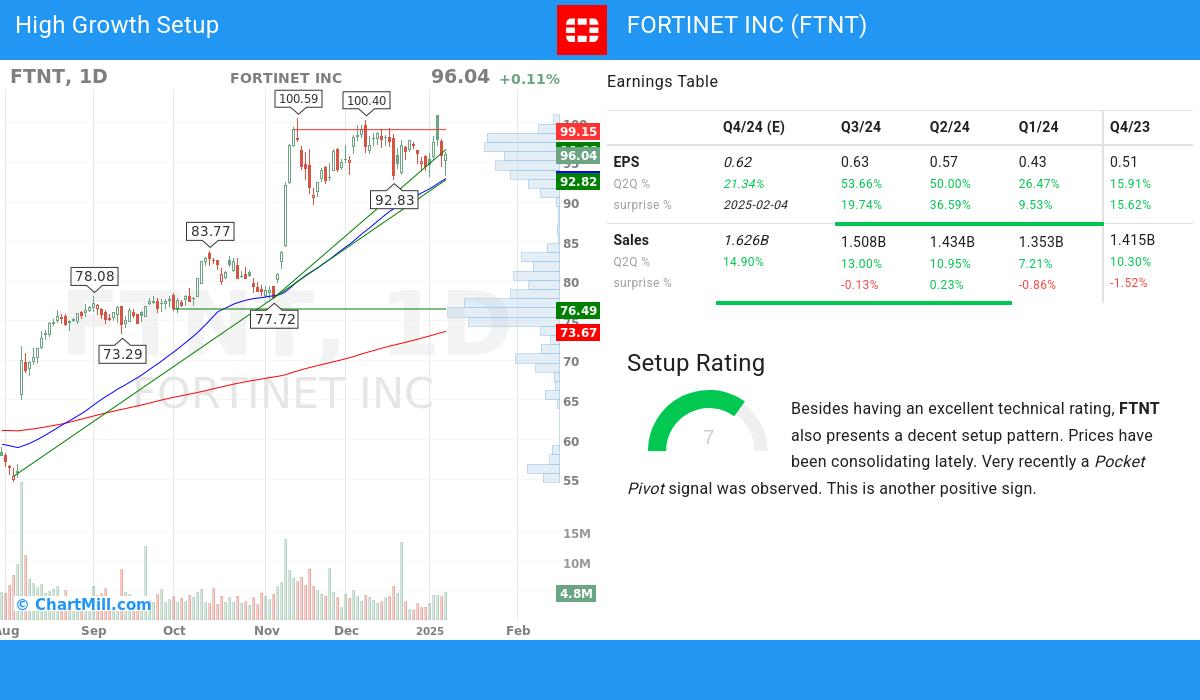
Alongside the Technical Rating, ChartMill assigns a Setup Rating to evaluate the consolidation level of a stock. This rating, ranging from 0 to 10, is updated daily and considers various short-term technical indicators. The current setup rating for NASDAQ:FTNT is 7:
FTNT has an excellent technical rating and also presents a decent setup pattern. Prices have been consolidating lately. Very recently a Pocket Pivot signal was observed. This is another positive sign.
What matters for high growth investors.
- With a favorable trend in its quarter-to-quarter (Q2Q) earnings per share (EPS), FORTINET INC highlights its ability to generate increasing profitability, showcasing a 53.66% growth.
- FORTINET INC has achieved 34.64% growth in EPS over the past 3 years, reflecting a sustained improvement in earnings performance.
- FORTINET INC has seen a 24.45% change in the average next Quarter EPS Estimate by analysts over the last 3 months, signaling the shifting perception of the company's EPS outlook.
- In the most recent financial report, FORTINET INC reported a 53.66% increase in quarterly earnings compared to the previous quarter. This notable growth indicates positive momentum in the company's financials, suggesting an upward trend
- accelerating EPS growth for FORTINET INC: the current Q2Q growth of 53.66% exceeds the previous year Q2Q growth of 24.24%.
- FORTINET INC has shown positive growth in its operating margin over the past year, indicating improved operational efficiency. This growth highlights the company's ability to effectively manage costs and maximize profitability.
- With a favorable trend in its free cash flow (FCF) over the past year, FORTINET INC demonstrates its ability to generate robust cash flows and maintain financial stability. This growth reflects the company's focus on efficient capital allocation and cash management.
- FORTINET INC showcases a robust Return on Equity (ROE) of 168.0%, indicating its ability to generate favorable returns for shareholders. This metric underscores the company's efficiency in utilizing its equity capital to generate profits.
- With a current Debt-to-Equity ratio at 1.09, FORTINET INC showcases its disciplined capital structure. The company's prudent management of debt obligations contributes to its financial stability and long-term sustainability.
- The ownership composition of FORTINET INC reflects a balanced investor ecosystem, with institutional shareholders owning 70.59%. This indicates a broader market participation and potential for increased trading liquidity.
- FORTINET INC has consistently surpassed EPS estimates in the last 4 quarters, reflecting its strong financial performance and effective management. This trend suggests the company's ability to generate positive earnings surprises and drive shareholder value.
- The Relative Strength (RS) of FORTINET INC has consistently been strong, with a current 89.81 rating. This indicates the stock's ability to exhibit relative price outperformance and reflects its competitive strength. FORTINET INC demonstrates promising potential for sustained price momentum.
More high growth momentum breakout stocks can be found in our High Growth Momentum Breakout screen.
Disclaimer
This article should in no way be interpreted as advice. The article is based on the observed metrics at the time of writing, but you should always make your own analysis and trade or invest at your own responsibility.