
Our stock screener has flagged FORTINET INC (NASDAQ:FTNT) as a potential breakout candidate. This occurs when the stock shows signs of consolidation after a notable upward trend. While we can't predict the actual breakout, it's worth monitoring NASDAQ:FTNT for potential movement.
What is the technical picture of NASDAQ:FTNT telling us.
ChartMill employs a sophisticated system to assign a Technical Rating to every stock in its analysis. This rating, which ranges from 0 to 10, is determined by carefully assessing multiple technical indicators and properties.
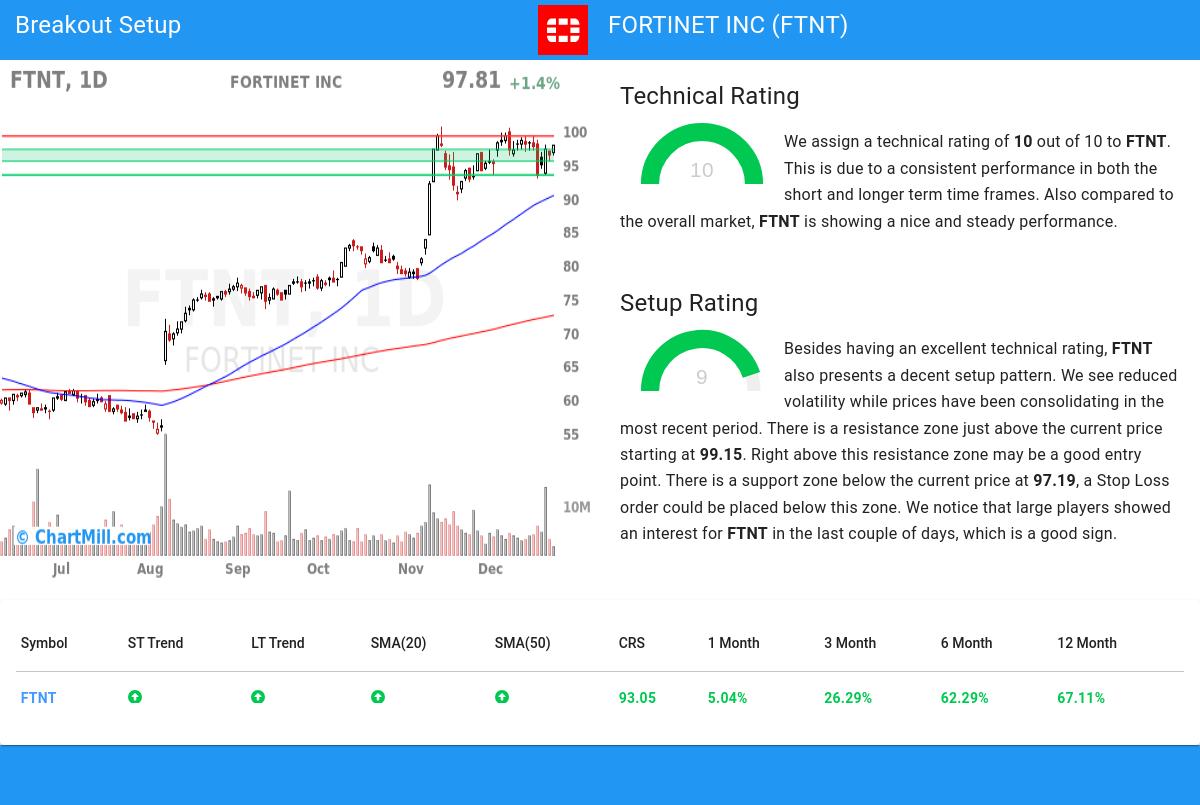
We assign a technical rating of 10 out of 10 to FTNT. Both in the recent history as in the last year, FTNT has proven to be a steady performer, scoring decent points in every aspect analyzed.
- The long and short term trends are both positive. This is looking good!
- When comparing the yearly performance of all stocks, we notice that FTNT is one of the better performing stocks in the market, outperforming 93% of all stocks. We also observe that the gains produced by FTNT over the past year are nicely spread over this period.
- FTNT is one of the better performing stocks in the Software industry, it outperforms 81% of 280 stocks in the same industry.
- FTNT is currently trading near its 52 week high, which is a good sign. The S&P500 Index however is also trading near new highs, which makes the performance in line with the market.
- In the last month FTNT has a been trading in the 92.83 - 100.40 range, which is quite wide. It is currently trading in the middle of this range where prices have been consolidating recently, this may present a good entry opportunity, but some resistance may be present above.
Our latest full technical report of FTNT contains the most current technical analsysis.
Looking at the Setup
In addition to the Technical Rating, ChartMill provides a Setup Rating for each stock. This rating, ranging from 0 to 10, assesses the extent of consolidation in the stock based on multiple short-term technical indicators. Currently, NASDAQ:FTNT has a 9 as its setup rating:
Besides having an excellent technical rating, FTNT also presents a decent setup pattern. Prices have been consolidating lately and the volatility has been reduced. There is a resistance zone just above the current price starting at 99.15. Right above this resistance zone may be a good entry point. There is a support zone below the current price at 97.19, a Stop Loss order could be placed below this zone. We notice that large players showed an interest for FTNT in the last couple of days, which is a good sign.
Trading breakout setups.
One strategy to consider is waiting for the actual breakout to occur, where the stock breaks out above the current consolidation zone. Traders can then enter a buy position, anticipating further upward momentum. As a risk management measure, it is advisable to set a stop loss order below the consolidation zone.
Please note that this article should not be construed as trading advice. The information provided is solely based on automated technical analysis and serves to highlight technical observations. It is important to conduct your own analysis and make trading decisions based on your own judgment and responsibility.
Our Breakout screener lists more breakout setups and is updated daily.
Disclaimer
Important Note: The content of this article is not intended as trading advice. It is essential to perform your own analysis and exercise caution when making trading decisions. The article presents observations created by automated analysis but does not guarantee any trading or investment outcomes. Always trade responsibly and make independent judgments.