
FORTINET INC (NASDAQ:FTNT) has been identified as a Technical Breakout Setup Pattern by our stock screener. This pattern typically occurs when a stock takes a pause after a significant rise, indicating the possibility of a continuation in the trend. While it's impossible to predict with certainty, it might be beneficial to monitor NASDAQ:FTNT.
Insights from Technical Analysis
Every day ChartMill assigns a Technical Rating to every stock. The score ranges from 0 to 10 and is determined by evaluating multiple technical indicators and properties.
We assign a technical rating of 10 out of 10 to FTNT. This is due to a consistent performance in both the short and longer term time frames. Also compared to the overall market, FTNT is showing a nice and steady performance.
- Both the short term and long term trends are positive. This is a very positive sign.
- Looking at the yearly performance, FTNT did better than 92% of all other stocks. We also observe that the gains produced by FTNT over the past year are nicely spread over this period.
- FTNT is one of the better performing stocks in the Software industry, it outperforms 79% of 279 stocks in the same industry.
- FTNT is currently trading in the upper part of its 52 week range. The S&P500 Index however is currently trading near a new high, so FTNT is lagging the market slightly.
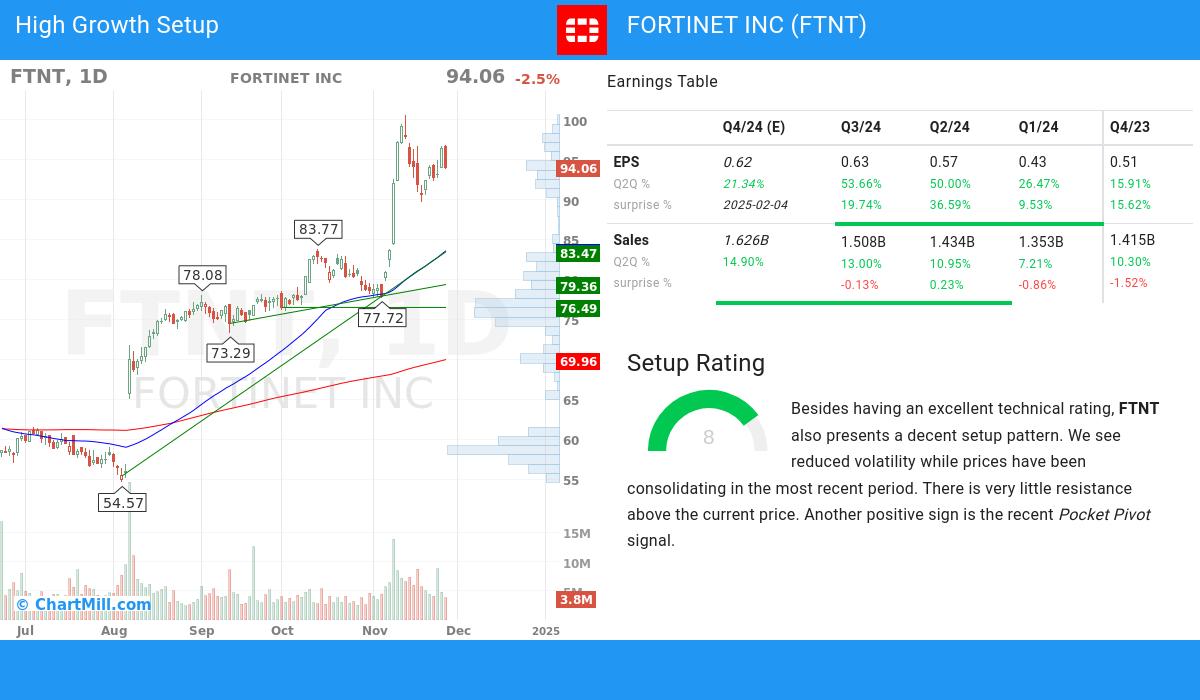
- In the last month FTNT has a been trading in the 77.72 - 100.59 range, which is quite wide. It is currently trading near the high of this range.
Check the latest full technical report of FTNT for a complete technical analysis.
Why is NASDAQ:FTNT a setup?
ChartMill also assign a Setup Rating to every stock. With this score it is determined to what extend the stock has been trading in a range in the recent days and weeks. This score also ranges from 0 to 10 and is updated daily. The setup score evaluates various short term technical indicators. NASDAQ:FTNT scores a 8 out of 10:
Besides having an excellent technical rating, FTNT also presents a decent setup pattern. We see reduced volatility while prices have been consolidating in the most recent period. There is very little resistance above the current price. Another positive sign is the recent Pocket Pivot signal.
Looking into the high growth metrics of FORTINET INC
- The recent financial report of FORTINET INC demonstrates a 53.66% increase in quarterly earnings compared to the previous quarter. This growth indicates positive momentum in the company's financials and suggests a promising upward trend
- FORTINET INC has experienced 34.64% growth in EPS over a 3-year period, demonstrating its ability to generate sustained and positive earnings momentum.
- The average next Quarter EPS Estimate by analysts was adjusted by 24.45%, reflecting the evolving market expectations for the company's EPS growth.
- The recent financial report of FORTINET INC demonstrates a 53.66% increase in quarterly earnings compared to the previous quarter. This growth indicates positive momentum in the company's financials and suggests a promising upward trend
- accelerating EPS growth for FORTINET INC: the current Q2Q growth of 53.66% exceeds the previous year Q2Q growth of 24.24%.
- The operating margin of FORTINET INC has seen steady growth over the past year, signaling improved profitability. This trend indicates the company's effective cost management and its ability to generate higher returns.
- FORTINET INC has shown positive growth in its free cash flow (FCF) over the past year, indicating improved cash generation and financial strength. This growth highlights the company's ability to effectively manage its cash flows and generate surplus funds.
- FORTINET INC has achieved an impressive Return on Equity (ROE) of 168.0%, showcasing its ability to generate favorable returns for shareholders.
- FORTINET INC maintains a healthy Debt-to-Equity ratio of 1.09. This indicates the company's conservative capital structure and signifies its ability to effectively manage debt obligations while maintaining a strong equity position.
- With 71.95% of the total shares held by institutional investors, FORTINET INC showcases a healthy distribution of ownership. This suggests a mix of institutional and retail investors, fostering a dynamic market for the stock.
- FORTINET INC has consistently surpassed EPS estimates in the last 4 quarters, reflecting its strong financial performance and effective management. This trend suggests the company's ability to generate positive earnings surprises and drive shareholder value.
- FORTINET INC has achieved an impressive Relative Strength (RS) rating of 92.19, showcasing its ability to outperform the broader market. This strong performance positions FORTINET INC as an attractive stock for potential price appreciation.
More high growth momentum breakout stocks can be found in our High Growth Momentum Breakout screen.
Keep in mind
Important Note: The content of this article is not intended as trading advice. It is essential to perform your own analysis and exercise caution when making trading decisions. The article presents observations created by automated analysis but does not guarantee any trading or investment outcomes. Always trade responsibly and make independent judgments.