
In this article we will dive into FORTINET INC (NASDAQ:FTNT) as a possible candidate for growth investing. Investors should always do their own research, but we noticed FORTINET INC showing up in our strong growth, ready to breakout screen, which makes it worth to investigate a bit more.
Understanding NASDAQ:FTNT's Growth
Every stock receives a Growth Rating from ChartMill, ranging from 0 to 10. This rating assesses various growth aspects, including historical and projected EPS and revenue growth. NASDAQ:FTNT boasts a 8 out of 10:
- FTNT shows a strong growth in Earnings Per Share. In the last year, the EPS has been growing by 28.86%, which is quite impressive.
- The Earnings Per Share has been growing by 35.13% on average over the past years. This is a very strong growth
- FTNT shows quite a strong growth in Revenue. In the last year, the Revenue has grown by 11.02%.
- The Revenue has been growing by 24.11% on average over the past years. This is a very strong growth!
- Based on estimates for the next years, FTNT will show a quite strong growth in Earnings Per Share. The EPS will grow by 16.69% on average per year.
- Based on estimates for the next years, FTNT will show a quite strong growth in Revenue. The Revenue will grow by 14.76% on average per year.
Health Analysis for NASDAQ:FTNT
ChartMill employs a unique Health Rating system for all stocks. This rating, ranging from 0 to 10, is determined by analyzing various liquidity and solvency ratios. For NASDAQ:FTNT, the assigned 6 for health provides valuable insights:
- An Altman-Z score of 5.86 indicates that FTNT is not in any danger for bankruptcy at the moment.
- With a decent Altman-Z score value of 5.86, FTNT is doing good in the industry, outperforming 69.39% of the companies in the same industry.
- The Debt to FCF ratio of FTNT is 0.63, which is an excellent value as it means it would take FTNT, only 0.63 years of fcf income to pay off all of its debts.
- With a decent Debt to FCF ratio value of 0.63, FTNT is doing good in the industry, outperforming 78.65% of the companies in the same industry.
- Although FTNT does not score too well on debt/equity it has very limited outstanding debt, which is well covered by the FCF. We will not put too much weight on the debt/equity number as it may be because of low equity, which could be a consequence of a share buyback program for instance. This needs to be investigated.
Analyzing Profitability Metrics
ChartMill utilizes a Profitability Rating to assess stocks, scoring them on a scale of 0 to 10. This rating takes into account a variety of profitability ratios and margins, both in absolute terms and in comparison to industry peers. NASDAQ:FTNT has earned a 9 out of 10:
- FTNT has a Return On Assets of 16.30%. This is amongst the best in the industry. FTNT outperforms 93.59% of its industry peers.
- FTNT has a better Return On Equity (455.55%) than 100.00% of its industry peers.
- The Return On Invested Capital of FTNT (26.33%) is better than 97.51% of its industry peers.
- Measured over the past 3 years, the Average Return On Invested Capital for FTNT is significantly above the industry average of 11.23%.
- The last Return On Invested Capital (26.33%) for FTNT is above the 3 year average (21.99%), which is a sign of increasing profitability.
- FTNT has a Profit Margin of 23.71%. This is amongst the best in the industry. FTNT outperforms 91.10% of its industry peers.
- In the last couple of years the Profit Margin of FTNT has grown nicely.
- FTNT has a better Operating Margin (26.05%) than 93.95% of its industry peers.
- FTNT's Operating Margin has improved in the last couple of years.
- FTNT has a Gross Margin of 78.09%. This is in the better half of the industry: FTNT outperforms 75.80% of its industry peers.
Why is NASDAQ:FTNT a setup?
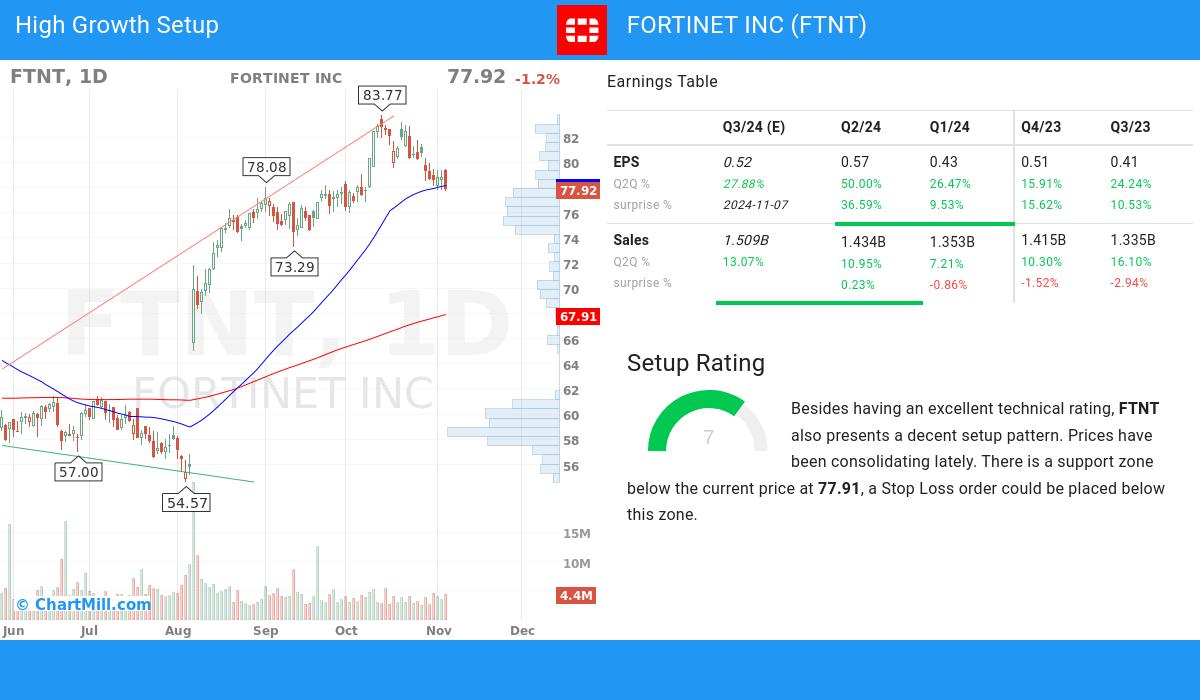
Next to the Technical Rating, the Setup Rating of a stock determines to which extend the stock is consolidating. This score also ranges from 0 to 10 and is updated daily. The setup score evaluates various short term technical indicators. For NASDAQ:FTNT this score is currently 7:
Besides having an excellent technical rating, FTNT also presents a decent setup pattern. Prices have been consolidating lately. There is a support zone below the current price at 77.91, a Stop Loss order could be placed below this zone.
Our Strong Growth screener lists more Strong Growth stocks and is updated daily.
Our latest full fundamental report of FTNT contains the most current fundamental analsysis.
Our latest full technical report of FTNT contains the most current technical analsysis.
Disclaimer
This article should in no way be interpreted as advice. The article is based on the observed metrics at the time of writing, but you should always make your own analysis and trade or invest at your own responsibility.