
For investors using a technical breakout strategy, the goal is to find stocks that are in a solid, confirmed uptrend and are also taking a break to consolidate. This break, or setup, forms a possible entry point for a new move upward. The method relies on two specific scores from ChartMill: the Technical Rating, which measures the general condition and trend force of a stock, and the Setup Quality Rating, which judges the condition of its present consolidation pattern. A good score in both areas indicates a stock is both technically good and ready for a possible breakout.
TECHNIPFMC PLC (NYSE:FTI) comes from a scan based on this idea, offering a strong case for technical investors. The energy services company has shown notable force and now seems to be building a positive pattern.
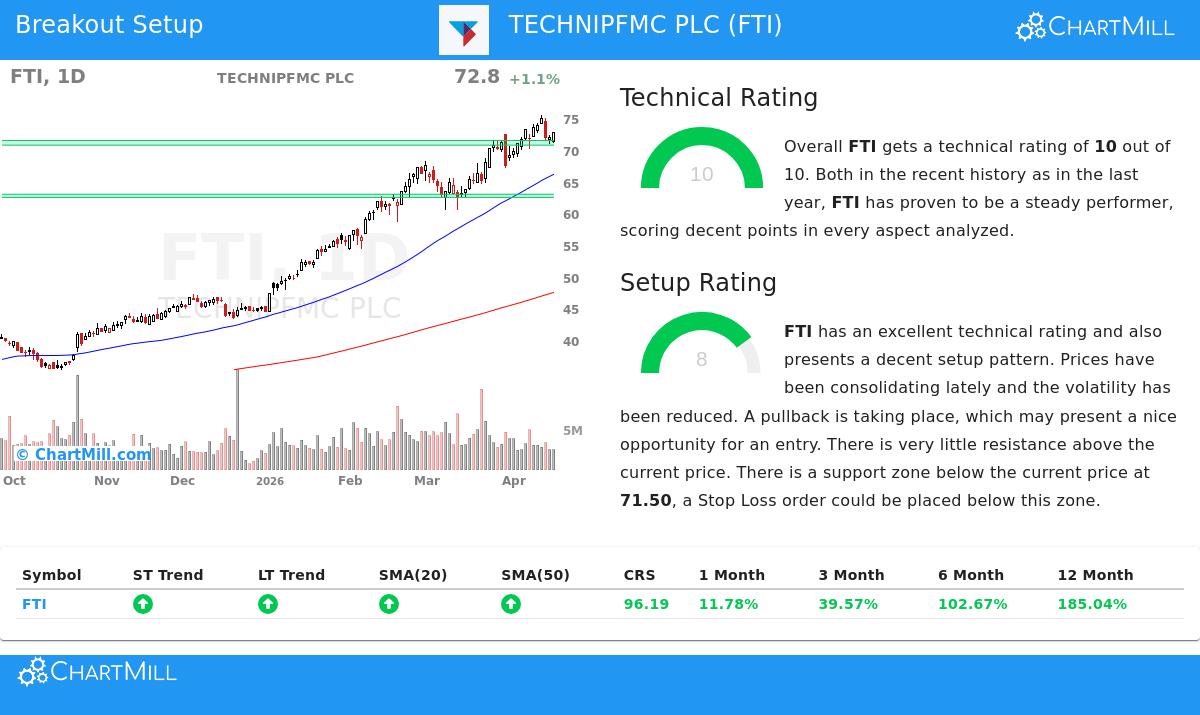
Notable Technical Force
The base of any breakout candidate is a solid primary trend, and TechnipFMC does very well here. The stock receives a complete ChartMill Technical Rating of 10, putting it with the market's best performers from a technical view. This high rating comes from a number of forceful, agreeing factors:
- Forceful Trend Agreement: Both the near-term and long-term trends are clearly positive, an important sign of continued momentum.
- Leading Relative Performance: Over the last year, FTI has done better than 96% of all stocks in the market. Inside its Energy Equipment & Services industry, it tops 83% of similar companies.
- Good Moving Average Support: The stock is trading above all its main moving averages (20, 50, 100, and 200-day), and each of these averages is in a rising pattern. This stacked support is a sign of a good uptrend.
- Nearness to Highs: FTI is now trading close to its 52-week high, confirming the force of its current rise.
This notable technical condition is important for the breakout strategy because it raises the chance that any move out of consolidation will keep going in the direction of the main trend, upward. A full review of these measures is in the ChartMill Technical Report for FTI.
A Good Setup Pattern
While a forceful trend is needed, it is not enough for a best entry. A stock that has risen quickly may be stretched and ready for a decline. This is where the Setup Quality Rating becomes key, as it finds times of consolidation that give a cleaner risk/reward picture. TechnipFMC gets an 8 out of 10 on this measure, showing a good setup.
The analysis notes that prices have been consolidating lately, with lower movement. The stock has moved in a band between about $64.61 and $75.52 over the last month and is now placed in the middle of this band. This action creates a specific structure:
- Defined Support Area: An important support area is found between $70.76 and $71.50, made by a mix of trendlines and main moving averages. This gives a sensible level for setting a protective stop-loss order.
- Minimal Resistance: There is seen to be very little resistance above the present price, pointing to a clean path upward if the stock can start a breakout.
- Automatic Setup Idea: Based on this pattern, the system proposes a possible trade idea with an entry order just above the recent band at $75.53 (a buy-stop) and an exit stop-loss just below the support area at $70.75.
This consolidation period is just what technical breakout investors seek. It lets the stock absorb its earlier gains, form a base of support, and prepare for its next possible rise.
Final Points and More Study
TechnipFMC shows a standard case for technical breakout screening, joining a top-level Technical Rating of 10 with a good Setup Rating of 8. The stock's forceful year-long uptrend, backed by rising moving averages and better relative performance, gives a solid push. Its present consolidation inside a defined band offers a structured chance with clear support and controlled risk.
For investors wanting to find other possible breakout setups each day, the basic screen can be reached and used in the ChartMill stock screener. You can find more results from the Technical Breakout Setups screen here.
Disclaimer: This article is for information only and does not form investment guidance, a suggestion, or an offer to buy or sell any security. The trade idea noted is automatically made for example and is not a support. Investors should do their own study, think about their risk comfort, and talk with a qualified financial advisor before making any investment choices. Past results are not a guide for future results.