
In the search for stocks with high potential, many investors and traders use organized methods that join detailed technical study with basic growth measures. One method is supported by Mark Minervini, a two-time U.S. Investing Champion, whose plan centers on finding stocks in strong upward moves that also have improving business foundations. This method, frequently summarized in his "Trend Template" for technical condition and paired with filters for strong growth momentum, aims to identify leaders early in their large price increases. The aim is not only to find stocks that are rising, but to find those with the basic force and growth path to continue and increase those rises.
FASTLY INC - CLASS A (NASDAQ:FSLY) stands as a present candidate that seems to fit this two-part plan. The company, which offers a real-time edge cloud platform for content delivery and security, has displayed a significant change in its stock chart and basic financial numbers over the last year.
Fitting the Minervini Trend Template
The central part of Minervini's technical selection is his Trend Template, a group of strict rules made to sort for stocks in established, strong upward moves. The template stresses agreement across several time periods and nearness to new highs, making sure an investor is purchasing strength, not weakness. An examination of Fastly's present technical position shows it fits these strict conditions:
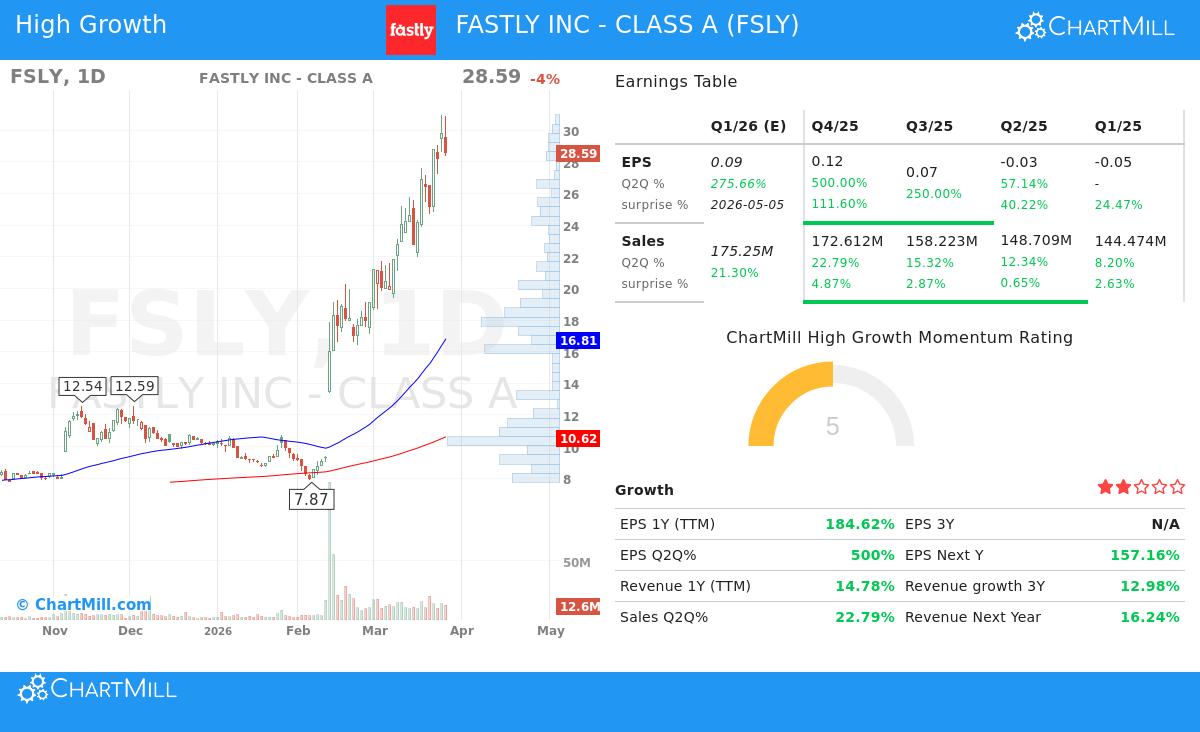
- Price Above Key Moving Averages: The stock's last price of $28.59 trades well above its rising 50-day ($16.81), 150-day ($11.82), and 200-day ($10.62) simple moving averages. This agreement confirms a positive trend across short, medium, and long-term time periods.
- Moving Average Agreement: The 50-day moving average is above both the 150-day and 200-day averages, and the 150-day is above the 200-day. This "stacked" order is a clear sign of a solid stage 2 upward move, showing continued and increasing buying pressure.
- Nearness to Highs: Fastly's price is within 8% of its 52-week high of $30.95, meeting the Trend Template's need of being within 25% of the high. At the same time, the stock is over 500% above its 52-week low of $4.65, greatly passing the 30% limit. This shows strong recovery momentum and a place of leadership.
- Better Relative Strength: With a ChartMill Relative Strength (CRS) score of 99.27, Fastly is doing better than almost all other stocks in the market over the past year. Minervini states that real market leaders show high relative strength, as it points to institutional demand and better performance no matter the wider market actions.
This technical view is important because Minervini's idea is to "buy high and sell higher," focusing on stocks that have already shown their strength instead of trying to catch a falling price. The Trend Template systematically applies this discipline.
Fitting as a High-Growth Candidate
While a strong chart is necessary, Minervini's SEPA (Specific Entry Point Analysis) plan gives similar importance to basic improvement. The "High Growth Momentum" part of the filter looks for companies showing fast gain in profitability and sales, the kind of basic "fuel" that can push a technical breakout into a continued major rise. Fastly's recent financial measures show this improvement:
- Large Earnings Gain: The company has moved to profitability with notable speed. Earnings Per Share (EPS) for the trailing twelve months (TTM) is at $0.11, showing year-over-year gain of 184.6%. More striking is the recent quarterly momentum, with the last quarter showing EPS gain of 500% compared to the same quarter last year.
- Positive Estimate Changes: Analyst opinion is getting stronger. The average estimate for next year's EPS has been changed upward by 103.9% over the last three months. Such large upward changes are a strong catalyst, often coming before more institutional buying as expectations are set higher.
- Revenue Gain and Steadiness: Top-line gain remains solid at 14.8% (TTM), with the most recent quarter increasing to 22.8% year-over-year. Also, Fastly has passed revenue estimates in each of the last four quarters, with an average pass of 2.76%, showing steady performance above market expectations.
- Good Cash Flow Production: Free Cash Flow per share has gained by 331% over the past year, an important sign of better operational efficiency and financial condition as the company grows.
This mix of increasing earnings, rising analyst expectations, and steady revenue performance gives the basic "story" that supports the stock's technical breakout. For growth investors, these measures suggest the company is moving past a pure growth-at-all-costs model into a time of profitable expansion, which can meaningfully lower the risk of the investment idea.
Technical Condition and Setup Points
According to ChartMill's own analysis, Fastly gets a complete Technical Rating of 10 out of 10, showing very good condition across all checked time periods and measures. The report states the long and short-term trends are both positive and that the stock is a top performer, doing better than 99% of the market and 98% of its IT Services industry group.
However, the analysis also gives a note of care for traders looking for an immediate entry. The Setup Quality Rating is presently a 3, showing that while the trend is strong, the recent price action has been changeable. The stock has traded in a wide band over the past month ($17.13 - $30.95) and is presently near the top of that band. From a Minervini view, this suggests the stock may be "stretched" from a possible consolidation base. The best setup would include a time of volatility decrease, where the price band narrows on lower volume, giving a lower-risk entry point on a later breakout. Investors may therefore decide to wait for such a shape to form or use a very disciplined method to position size if thinking about an entry at present levels.
A full review of the technical view, including support/resistance levels and volume study, is in the detailed ChartMill Technical Report for FSLY.
Summary and Forward View
Fastly offers a strong example of a stock that fits a disciplined growth and momentum plan. It meets the strict technical filters of the Minervini Trend Template, confirming it is in a controlling upward move and a market leader. Basically, it shows the high-growth momentum marked by large earnings gain, solid analyst changes, and steady revenue performance. This combination between chart strength and business improvement is exactly what plans like Minervini's aim to find.
It is necessary to recall that even the strongest setups have risk, and the present low setup rating suggests waiting for a best risk/reward entry. The wider market situation, with both long and short-term trends for the S&P 500 presently negative, also calls for care and shows the need for strict risk control on any single position.
For investors interested in finding other stocks that meet this mix of technical skill and high-growth basics, the filter that found Fastly can be a useful beginning point. You can find more possible candidates by exploring this High Growth Momentum + Trend Template screen.
Disclaimer: This article is for informational and educational purposes only. It is not intended as investment advice, nor does it constitute a recommendation to buy, sell, or hold any security. The analysis is based on data provided and methodologies referenced, but past performance is not indicative of future results. Investors should conduct their own due diligence and consider their individual financial circumstances and risk tolerance before making any investment decisions. Please read our full disclaimer and terms of use for more information.