
Identifying promising stocks often involves blending rigorous technical analysis with a focus on fundamental growth. One systematic approach to this is the Mark Minervini strategy, which uses a specific Trend Template to find stocks in strong, established uptrends. This method filters for securities where price action, moving averages, and relative strength all align to signal sustained momentum. To further improve the search for potential winners, this technical base can be joined with a High Growth Momentum (HGM) rating, which evaluates a company's earnings and sales path. This two-part method aims to find companies that are not only technically sound but also displaying the fundamental acceleration that often comes before major price gains.
Fifth Third Bancorp (NASDAQ:FITB) recently appeared from a screen made to join these two ideas. The regional bank holding company seems to meet the core technical checklist for a Minervini-style setup while also reporting fundamental numbers that justify a closer examination from growth-focused investors.
Assessing the Trend Template Alignment
The Minervini Trend Template is a strict set of technical conditions made to filter for stocks in a clear Stage 2 advance. For FITB, the current chart setup shows a notable alignment with these rules:
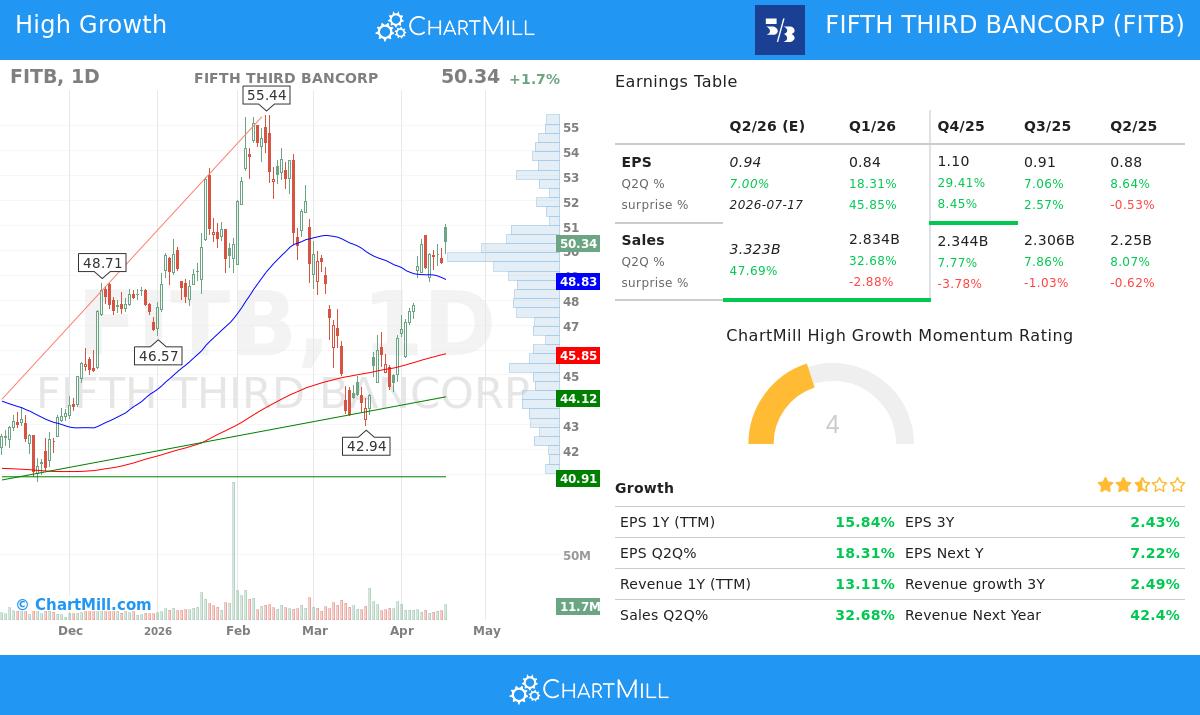
- Price Above Key Moving Averages: The stock's last price of $50.34 trades well above its rising 150-day ($46.67) and 200-day ($45.85) simple moving averages (SMAs). This is a main requirement, showing the long-term trend is positive.
- Moving Average Alignment: The shorter-term 50-day SMA ($48.83) is positioned above both the 150-day and 200-day SMAs. Also, the 150-day SMA is above the 200-day SMA. This ordered bullish alignment of averages is a key feature of the Trend Template, confirming that momentum is increasing across several timeframes.
- Proximity to Highs: A central part of Minervini's philosophy is to concentrate on strength, not weakness. FITB's price is about 53% above its 52-week low of $32.79 and within 10% of its 52-week high of $55.44. This meets the condition of being meaningfully off its lows while still testing recent highs, indicating the momentum is continuing.
- Strong Relative Strength: The stock has a ChartMill Relative Strength (CRS) rating of 76.27, meaning it has performed better than about 76% of the market over the past year. Minervini notes that true market leaders usually have RS ratings above 70, and ideally in the 80s or 90s, as they often lead the next phase of a bull market.
This combination of elements indicates FITB is operating within a sound, long-term uptrend with no major technical warnings, making it a suitable subject for more study under the Minervini method.
Evaluating High Growth Momentum Fundamentals
While the Trend Template confirms a stock is in the right technical condition, the High Growth Momentum rating tries to find the fundamental "engine" that might push future performance. For FITB, several numbers are notable, especially when seen from the perspective of a financial institution.
- Strong Earnings Growth: The company has shown major bottom-line growth. Earnings per share (EPS) grew 15.8% over the trailing twelve months (TTM). More notably, recent quarterly momentum is solid, with the last reported quarter showing year-over-year EPS growth of 18.3%, and the quarter before that reporting 29.4% growth. This increase is a vital component often observed in stocks before large price advances.
- Improving Profitability: Profit margins have shown clear betterment. The profit margin in the most recent quarter was 29.9%, a large rise from 22.4% reported three quarters earlier. This pattern of growing margins shows better operational efficiency and pricing power, which is highly regarded by growth investors.
- Solid Cash Flow Generation: Free cash flow per share has risen sharply, growing over 63% in the past year to $4.34. Solid and increasing cash flow gives a company options to invest in growth, reduce debt, or return capital to shareholders, supporting the durability of its expansion.
- Positive Revenue Revisions: While some earnings estimate revisions have been slightly negative, analysts have meaningfully lifted their revenue expectations for the next year by almost 10% over the past three months. This upward revision in the top-line forecast shows increasing confidence in the company's core business growth.
These fundamental elements lead to a positive High Growth Momentum profile, suggesting the technical soundness seen in FITB's chart may be backed by real business performance.
Technical Condition and Setup Considerations
A look at the ChartMill Technical Report for FITB gives a combined view of its market position. The report gives the stock a high technical rating of 8 out of 10, noting its steady performance across both short and long-term timeframes and its consistent better performance relative to the wider market. The long-term and short-term trends are both labeled positive.
However, the report states that while the technical condition is very good, the current setup quality is medium, with a rating of 4. This shows that recent price movement has been a bit unstable, making a perfect, low-risk entry point less obvious at this precise moment. The study proposes waiting for a time of consolidation to form a more clear structure. Important support levels are found between $44.12-$44.38 and near $43.39, which could act as possible areas for the stock to settle.
For a detailed summary of the support and resistance levels, trend study, and full notes, you can examine the complete ChartMill Technical Analysis Report for FITB.
Finding Similar Opportunities
The joining of Minervini's trend discipline and growth momentum screening can be an effective method for finding potential investment candidates. FITB acts as an example of a stock that currently passes this two-part filter.
For investors keen on finding other securities that meet similar conditions of solid technical trends and increasing fundamentals, the predefined "High Growth Momentum + Trend Template" screen is ready to examine. You can view this screen and see its current results here: High Growth Momentum + Trend Template Screen.
Disclaimer: This article is for informational and educational purposes only. It is not a recommendation to buy or sell any security. The analysis is based on data provided and specific screening methods. All investing involves risk, including the potential loss of principal. You should conduct your own research and consider consulting with a qualified financial advisor before making any investment decisions. Please read our full disclaimer here.