
For investors who use technical analysis to find possible trades, a common method looks for stocks that show both good technical condition and are ready for a price move. This method tries to join the momentum of a stock in a good upward path with the accuracy of a clear entry point, often seen during times of price stability. One way to find these chances is by using filters that look for a high proprietary Technical Rating, which judges the general condition and path of a stock, and a high Setup Quality Rating, which finds narrow price areas that frequently come before a new directional price change. This two-part filter tries to point out securities where the basic path is positive and the risk-reward view is made clearer by recent price movement.
Fastenal Co (NASDAQ:FAST), a top distributor of industrial and construction supplies, recently appeared from this kind of technical breakout filter. The company's stock shows a condition that technical investors may find interesting, as it rates well on both the path and setup quality measures important to this method.
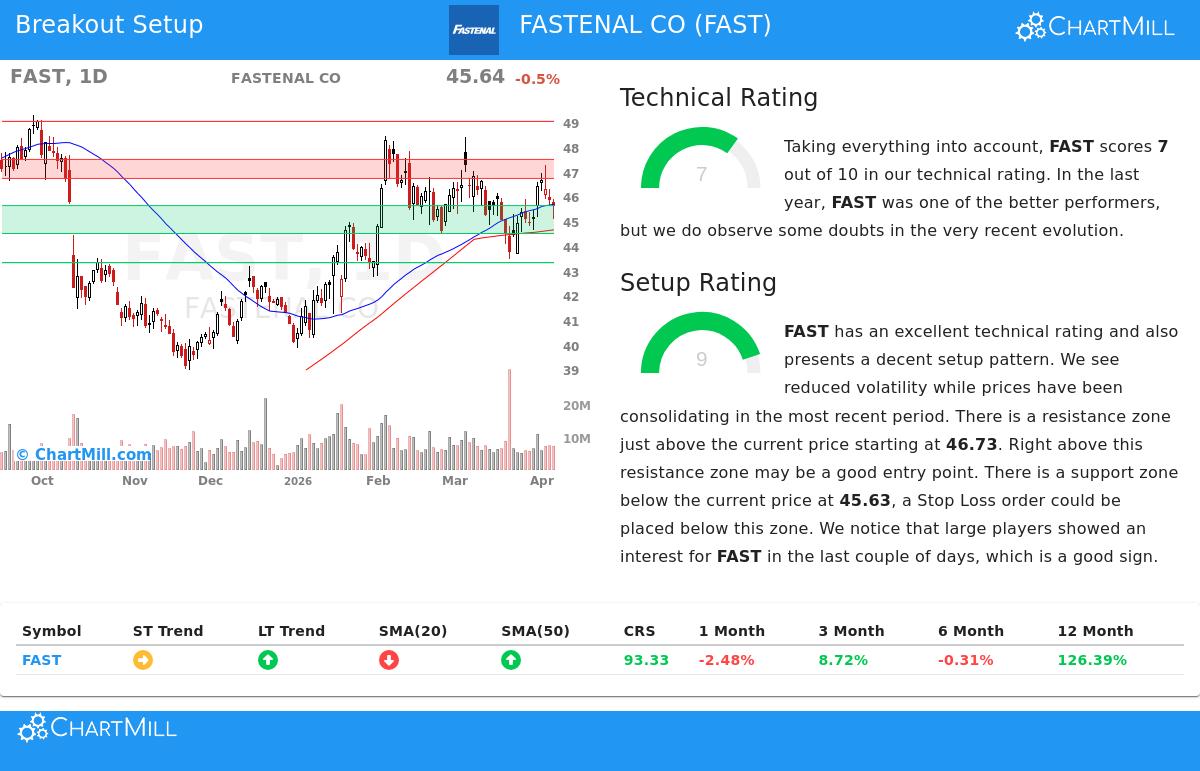
Looking at the Technical Base
The first part of this breakout method is finding stocks with good technical condition, which points to a better chance that any upward change will continue instead of a short-lived rise. Fastenal’s present ChartMill Technical Rating of 7 out of 10 shows a stock in a confirmed upward path. This rating combines several parts across different time periods to measure relative strength and path agreement.
Important technical points supporting this rating are:
- Long-Term Path: The long-term path for FAST is seen as positive, giving a good setting for bullish setups even while wider market measures like the S&P 500 show negative paths.
- Relative Strength: The stock does better than 95% of similar companies in the Trading Companies & Distributors industry and has given a notable 126% increase over the last year, showing clear leadership.
- Place vs. Market: FAST is trading in the higher part of its 52-week range, performing similarly to the S&P 500 which is also in the higher part of its range, showing it is keeping its gains during market conditions.
- Moving Average Agreement: The stock price stays above important long-term moving averages (the 50-day, 100-day, and 200-day SMAs), which are all in rising patterns, a clear sign of basic strength.
While the short-term path is now neutral and some recent momentum has slowed, the basic long-term path and strong relative performance make FAST a technically good choice for the method.
Judging the Setup Quality
A strong path alone is not a signal to buy; entering during a strong but stretched rise can lead to quick declines. This is where the Setup Quality Rating becomes important. It finds stability phases, times where the stock trades in a small range, which frequently prepare for the next step higher by setting clear support and resistance points. Fastenal gets a very good Setup Rating of 9, pointing out a high-grade pattern.
The technical report explains why this setup is notable:
- Stability and Volatility: Over the last month, FAST has traded in a set range between about $43.47 and $47.26. Recently, prices have been stabilizing in the middle of this range with lower volatility, a common trait before a possible breakout.
- Clear Support and Resistance: The setup is bounded by clear technical points. An important support area exists between $44.50 and $45.63, made by a combination of moving averages and trendlines. Just above the present price, a resistance area sits between $46.73 and $47.50.
- Large Trader Interest: The report states that large traders have shown interest in FAST in recent days, as measured by volume study, which can be a confirming signal for a coming change.
This organized setting allows for a planned trade idea. A breakout above the resistance area could signal the start of a new upward change, while the well-set support area below gives a logical place to set a protective stop-loss order, clearly stating the risk.
A Possible Trade Plan
From this study, a sample technical setup is made. It proposes an entry point just above the resistance at $47.51, using a buy-stop order to confirm the breakout has happened. The suggested exit (stop-loss) is placed just below the support area at $44.49. This plan describes a possible risk of about 6.4% on the trade, a measurable number that allows for correct position size. It is important to remember that this is an example taken from the technical points; investors must adjust any trade to their own risk comfort and method, and always know about coming company events like earnings reports.
For investors wanting to find similar technical setups each day, the Technical Breakout Setups filter methodically sorts the market for stocks showing this mix of solid technicals and high-grade stability patterns.
Disclaimer: This article is for information only and does not make investment advice, a suggestion, or an offer or request to buy or sell any securities. The study shown is based on technical measures and past data, which are not promises of future results. Investing has risk, including the possible loss of the main amount. Always do your own study and think about your money situation and risk comfort before making any investment choices.